Prometheus udb-exporter 监控
简介
udb-exporter 用于采集udb运行指标,管理员可以根据这些指标全面掌握数据库运行情况,结合prometheus+grafana,可以实现图形展示及报警功能;
安装配置
准备账号
建议使用单独的账号用于监控,并分配合适的权限。 以管理员身份登录udb,执行以下sql
CREATE OR REPLACE FUNCTION __tmp_create_user() returns void as $$
BEGIN
  IF NOT EXISTS (
          SELECT                       -- SELECT list can stay empty for this
          FROM   pg_catalog.pg_user
          WHERE  usename = 'udb_exporter') THEN
    CREATE USER udb_exporter;
  END IF;
END;
$$ language plpgsql;
SELECT __tmp_create_user();
DROP FUNCTION __tmp_create_user();
-- 创建临时函数,用来创建监控用户udb_exporter
ALTER USER udb_exporter WITH PASSWORD 'password';
-- 创建用户密码,密码按需修改
ALTER USER udb_exporter SET SEARCH_PATH TO udb_exporter,pg_catalog;
--配置模式搜索路径
GRANT CONNECT ON DATABASE unvdb TO udb_exporter;
GRANT pg_monitor to udb_exporter;
CREATE SCHEMA IF NOT EXISTS udb_exporter;
GRANT USAGE ON SCHEMA udb_exporter TO udb_exporter;
-- 配置权限
CREATE OR REPLACE FUNCTION get_pg_stat_activity() RETURNS SETOF pg_stat_activity AS
$$ SELECT * FROM pg_catalog.pg_stat_activity; $$
LANGUAGE sql
VOLATILE
SECURITY DEFINER;
CREATE OR REPLACE VIEW udb_exporter.pg_stat_activity
AS SELECT * from get_pg_stat_activity();
GRANT SELECT ON udb_exporter.pg_stat_activity TO udb_exporter;
-- 配置获取连接信息视图
CREATE OR REPLACE FUNCTION get_pg_stat_replication() RETURNS SETOF pg_stat_replication AS
$$ SELECT * FROM pg_catalog.pg_stat_replication; $$
LANGUAGE sql
VOLATILE
SECURITY DEFINER;
CREATE OR REPLACE VIEW udb_exporter.pg_stat_replication
AS SELECT * FROM get_pg_stat_replication();
GRANT SELECT ON udb_exporter.pg_stat_replication TO udb_exporter;
-- 配置获取主从信息视图
CREATE EXTENSION IF NOT EXISTS pg_stat_statements;
CREATE OR REPLACE FUNCTION get_pg_stat_statements() RETURNS SETOF pg_stat_statements AS
$$ SELECT * FROM public.pg_stat_statements; $$
LANGUAGE sql
VOLATILE
SECURITY DEFINER;
CREATE OR REPLACE VIEW udb_exporter.pg_stat_statements
AS SELECT * FROM get_pg_stat_statements();
GRANT SELECT ON udb_exporter.pg_stat_statements TO udb_exporter;
-- 配置监控视图,需要开启pg_stat_statements模块
二进制方式运行
获取程序
联系技术支持获取
启动
export  DATA_SOURCE_NAME="user=monitor host=udb服务器ip password=monitorpwd port=5678 dbname=unvdb sslmode=disable"
./udb_exporter --web.listen-address=":9187"  --log.level=debug --web.telemetry-path="/metrics" &>>/var/log/udb-exporter.log &
#指定端口9187
#路径是/metrics
#输出debug日志到/var/log/udb-exporter.log,生产环境不建议开启debug
#&在后台运行
更多参数参考

usage: udb_exporter [<flags>]
Flags:
      -h, --help                 Show context-sensitive help (also try --help-long and --help-man).
      --collector.database       Enable the database collector (default: enabled).
      --collector.bgwriter       Enable the bgwriter collector (default: enabled).
      --web.listen-address=":9187"  Address to listen on for web interface and telemetry.
      --web.config.file=""       [EXPERIMENTAL] Path to configuration file that can enable TLS or authentication.
      --web.telemetry-path="/metrics"  Path under which to expose metrics.
      --disable-default-metrics  Do not include default metrics.
      --disable-settings-metrics Do not include pg_settings metrics.
      --auto-discover-databases  Whether to discover the databases on a server dynamically.
      --extend.query-path=""     Path to custom queries to run.
      --dumpmaps                 Do not run, simply dump the maps.
      --constantLabels=""        A list of label=value separated by comma(,).
      --exclude-databases=""     A list of databases to remove when autoDiscoverDatabases is enabled
      --include-databases=""     A list of databases to include when autoDiscoverDatabases is enabled
      --metric-prefix="pg"       A metric prefix can be used to have non-default (not "pg") prefixes for each of the metrics
      --version                  Show application version.
      --log.level=info           Only log messages with the given severity or above. One of: [debug, info, warn, error]
      --log.format=logfmt        Output format of log messages. One of: [logfmt, json]
容器方式运行
获取镜像
联系技术支持获取容器镜像
导入镜像并启动
docker run -d --restart=always -p 9187:9187 -e DATA_SOURCE_NAME="postgresql://monitor:monitorpwd@udb服务器ip:5678/unvdb?sslmode=disable" -e PG_EXPORTER_AUTO_DISCOVER_DATABASES=true udb_exporter
更多环境变量参考
DATA_SOURCE_NAME the default legacy format. Accepts URI form and key=value form arguments. The URI may contain the username and password to connect with.
DATA_SOURCE_URI an alternative to DATA_SOURCE_NAME which exclusively accepts the hostname without a username and password component. For example, my_pg_hostname or my_pg_hostname?sslmode=disable.
DATA_SOURCE_URI_FILE The same as above but reads the URI from a file.
DATA_SOURCE_USER When using DATA_SOURCE_URI, this environment variable is used to specify the username.
DATA_SOURCE_USER_FILE The same, but reads the username from a file.
DATA_SOURCE_PASS When using DATA_SOURCE_URI, this environment variable is used to specify the password to connect with.
DATA_SOURCE_PASS_FILE The same as above but reads the password from a file.
PG_EXPORTER_WEB_LISTEN_ADDRESS Address to listen on for web interface and telemetry. Default is :9187.
PG_EXPORTER_WEB_TELEMETRY_PATH Path under which to expose metrics. Default is /metrics.
PG_EXPORTER_DISABLE_DEFAULT_METRICS Use only metrics supplied from queries.yaml. Value can be true or false. Default is false.
PG_EXPORTER_DISABLE_SETTINGS_METRICS Use the flag if you don’t want to scrape pg_settings. Value can be true or false. Default is false.
PG_EXPORTER_AUTO_DISCOVER_DATABASES Whether to discover the databases on a server dynamically. Value can be true or false. Default is false.
PG_EXPORTER_EXTEND_QUERY_PATH Path to a YAML file containing custom queries to run. Check out queries.yaml for examples of the format.
PG_EXPORTER_CONSTANT_LABELS Labels to set in all metrics. A list of label=value pairs, separated by commas.
PG_EXPORTER_EXCLUDE_DATABASES A comma-separated list of databases to remove when autoDiscoverDatabases is enabled. Default is empty string.
PG_EXPORTER_INCLUDE_DATABASES A comma-separated list of databases to only include when autoDiscoverDatabases is enabled. Default is empty string, means allow all.
PG_EXPORTER_METRIC_PREFIX A prefix to use for each of the default metrics exported by postgres-exporter. Default is pg
自定义监控指标
创建自定义查询文件queries.yaml cat queries.yaml
pg_replication:
  query: "SELECT CASE WHEN NOT pg_is_in_recovery() THEN 0 ELSE GREATEST (0, EXTRACT(EPOCH FROM (now() - pg_last_xact_replay_timestamp()))) END AS lag"
  master: true
  metrics:
    - lag:
        usage: "GAUGE"
        description: "Replication lag behind master in seconds"
pg_postmaster:
  query: "SELECT pg_postmaster_start_time as start_time_seconds from pg_postmaster_start_time()"
  master: true
  metrics:
    - start_time_seconds:
        usage: "GAUGE"
        description: "Time at which postmaster started"
pg_stat_user_tables:
  query: |
   SELECT
     current_database() datname,
     schemaname,
     relname,
     seq_scan,
     seq_tup_read,
     idx_scan,
     idx_tup_fetch,
     n_tup_ins,
     n_tup_upd,
     n_tup_del,
     n_tup_hot_upd,
     n_live_tup,
     n_dead_tup,
     n_mod_since_analyze,
     COALESCE(last_vacuum, '1970-01-01Z') as last_vacuum,
     COALESCE(last_autovacuum, '1970-01-01Z') as last_autovacuum,
     COALESCE(last_analyze, '1970-01-01Z') as last_analyze,
     COALESCE(last_autoanalyze, '1970-01-01Z') as last_autoanalyze,
     vacuum_count,
     autovacuum_count,
     analyze_count,
     autoanalyze_count
   FROM
     pg_stat_user_tables
  metrics:
    - datname:
        usage: "LABEL"
        description: "Name of current database"
    - schemaname:
        usage: "LABEL"
        description: "Name of the schema that this table is in"
    - relname:
        usage: "LABEL"
        description: "Name of this table"
    - seq_scan:
        usage: "COUNTER"
        description: "Number of sequential scans initiated on this table"
    - seq_tup_read:
        usage: "COUNTER"
        description: "Number of live rows fetched by sequential scans"
    - idx_scan:
        usage: "COUNTER"
        description: "Number of index scans initiated on this table"
    - idx_tup_fetch:
        usage: "COUNTER"
        description: "Number of live rows fetched by index scans"
    - n_tup_ins:
        usage: "COUNTER"
        description: "Number of rows inserted"
    - n_tup_upd:
        usage: "COUNTER"
        description: "Number of rows updated"
    - n_tup_del:
        usage: "COUNTER"
        description: "Number of rows deleted"
    - n_tup_hot_upd:
        usage: "COUNTER"
        description: "Number of rows HOT updated (i.e., with no separate index update required)"
    - n_live_tup:
        usage: "GAUGE"
        description: "Estimated number of live rows"
    - n_dead_tup:
        usage: "GAUGE"
        description: "Estimated number of dead rows"
    - n_mod_since_analyze:
        usage: "GAUGE"
        description: "Estimated number of rows changed since last analyze"
    - last_vacuum:
        usage: "GAUGE"
        description: "Last time at which this table was manually vacuumed (not counting VACUUM FULL)"
    - last_autovacuum:
        usage: "GAUGE"
        description: "Last time at which this table was vacuumed by the autovacuum daemon"
    - last_analyze:
        usage: "GAUGE"
        description: "Last time at which this table was manually analyzed"
    - last_autoanalyze:
        usage: "GAUGE"
        description: "Last time at which this table was analyzed by the autovacuum daemon"
    - vacuum_count:
        usage: "COUNTER"
        description: "Number of times this table has been manually vacuumed (not counting VACUUM FULL)"
    - autovacuum_count:
        usage: "COUNTER"
        description: "Number of times this table has been vacuumed by the autovacuum daemon"
    - analyze_count:
        usage: "COUNTER"
        description: "Number of times this table has been manually analyzed"
    - autoanalyze_count:
        usage: "COUNTER"
        description: "Number of times this table has been analyzed by the autovacuum daemon"
pg_statio_user_tables:
  query: "SELECT current_database() datname, schemaname, relname, heap_blks_read, heap_blks_hit, idx_blks_read, idx_blks_hit, toast_blks_read, toast_blks_hit, tidx_blks_read, tidx_blks_hit FROM pg_statio_user_tables"
  metrics:
    - datname:
        usage: "LABEL"
        description: "Name of current database"
    - schemaname:
        usage: "LABEL"
        description: "Name of the schema that this table is in"
    - relname:
        usage: "LABEL"
        description: "Name of this table"
    - heap_blks_read:
        usage: "COUNTER"
        description: "Number of disk blocks read from this table"
    - heap_blks_hit:
        usage: "COUNTER"
        description: "Number of buffer hits in this table"
    - idx_blks_read:
        usage: "COUNTER"
        description: "Number of disk blocks read from all indexes on this table"
    - idx_blks_hit:
        usage: "COUNTER"
        description: "Number of buffer hits in all indexes on this table"
    - toast_blks_read:
        usage: "COUNTER"
        description: "Number of disk blocks read from this table's TOAST table (if any)"
    - toast_blks_hit:
        usage: "COUNTER"
        description: "Number of buffer hits in this table's TOAST table (if any)"
    - tidx_blks_read:
        usage: "COUNTER"
        description: "Number of disk blocks read from this table's TOAST table indexes (if any)"
    - tidx_blks_hit:
        usage: "COUNTER"
        description: "Number of buffer hits in this table's TOAST table indexes (if any)"
# WARNING: This set of metrics can be very expensive on a busy server as every unique query executed will create an additional time series
pg_stat_statements:
  query: "SELECT t2.rolname, t3.datname, queryid, calls, total_exec_time / 1000 as total_time_seconds, min_exec_time / 1000 as min_time_seconds, max_exec_time / 1000 as max_time_seconds, mean_exec_time / 1000 as mean_time_seconds, stddev_exec_time / 1000 as stddev_time_seconds, rows, shared_blks_hit, shared_blks_read, shared_blks_dirtied, shared_blks_written, local_blks_hit, local_blks_read, local_blks_dirtied, local_blks_written, temp_blks_read, temp_blks_written, blk_read_time / 1000 as blk_read_time_seconds, blk_write_time / 1000 as blk_write_time_seconds FROM pg_stat_statements t1 JOIN pg_roles t2 ON (t1.userid=t2.oid) JOIN pg_database t3 ON (t1.dbid=t3.oid) WHERE t2.rolname != 'rdsadmin'"
  master: true
  metrics:
    - rolname:
        usage: "LABEL"
        description: "Name of user"
    - datname:
        usage: "LABEL"
        description: "Name of database"
    - queryid:
        usage: "LABEL"
        description: "Query ID"
    - calls:
        usage: "COUNTER"
        description: "Number of times executed"
    - total_time_seconds:
        usage: "COUNTER"
        description: "Total time spent in the statement, in milliseconds"
    - min_time_seconds:
        usage: "GAUGE"
        description: "Minimum time spent in the statement, in milliseconds"
    - max_time_seconds:
        usage: "GAUGE"
        description: "Maximum time spent in the statement, in milliseconds"
    - mean_time_seconds:
        usage: "GAUGE"
        description: "Mean time spent in the statement, in milliseconds"
    - stddev_time_seconds:
        usage: "GAUGE"
        description: "Population standard deviation of time spent in the statement, in milliseconds"
    - rows:
        usage: "COUNTER"
        description: "Total number of rows retrieved or affected by the statement"
    - shared_blks_hit:
        usage: "COUNTER"
        description: "Total number of shared block cache hits by the statement"
    - shared_blks_read:
        usage: "COUNTER"
        description: "Total number of shared blocks read by the statement"
    - shared_blks_dirtied:
        usage: "COUNTER"
        description: "Total number of shared blocks dirtied by the statement"
    - shared_blks_written:
        usage: "COUNTER"
        description: "Total number of shared blocks written by the statement"
    - local_blks_hit:
        usage: "COUNTER"
        description: "Total number of local block cache hits by the statement"
    - local_blks_read:
        usage: "COUNTER"
        description: "Total number of local blocks read by the statement"
    - local_blks_dirtied:
        usage: "COUNTER"
        description: "Total number of local blocks dirtied by the statement"
    - local_blks_written:
        usage: "COUNTER"
        description: "Total number of local blocks written by the statement"
    - temp_blks_read:
        usage: "COUNTER"
        description: "Total number of temp blocks read by the statement"
    - temp_blks_written:
        usage: "COUNTER"
        description: "Total number of temp blocks written by the statement"
    - blk_read_time_seconds:
        usage: "COUNTER"
        description: "Total time the statement spent reading blocks, in milliseconds (if track_io_timing is enabled, otherwise zero)"
    - blk_write_time_seconds:
        usage: "COUNTER"
        description: "Total time the statement spent writing blocks, in milliseconds (if track_io_timing is enabled, otherwise zero)"
pg_process_idle:
  query: |
    WITH
      metrics AS (
        SELECT
          application_name,
          SUM(EXTRACT(EPOCH FROM (CURRENT_TIMESTAMP - state_change))::bigint)::float AS process_idle_seconds_sum,
          COUNT(*) AS process_idle_seconds_count
        FROM pg_stat_activity
        WHERE state = 'idle'
        GROUP BY application_name
      ),
      buckets AS (
        SELECT
          application_name,
          le,
          SUM(
            CASE WHEN EXTRACT(EPOCH FROM (CURRENT_TIMESTAMP - state_change)) <= le
              THEN 1
              ELSE 0
            END
          )::bigint AS bucket
        FROM
          pg_stat_activity,
          UNNEST(ARRAY[1, 2, 5, 15, 30, 60, 90, 120, 300]) AS le
        GROUP BY application_name, le
        ORDER BY application_name, le
      )
    SELECT
      application_name,
      process_idle_seconds_sum as seconds_sum,
      process_idle_seconds_count as seconds_count,
      ARRAY_AGG(le) AS seconds,
      ARRAY_AGG(bucket) AS seconds_bucket
    FROM metrics JOIN buckets USING (application_name)
    GROUP BY 1, 2, 3
  metrics:
    - application_name:
        usage: "LABEL"
        description: "Application Name"
    - seconds:
        usage: "HISTOGRAM"
        description: "Idle time of server processes"
udb_exporter --web.listen-address=":9187"  --web.telemetry-path="/metrics" --extend.query-path="./queries.yaml" &>>/var/log/udb-exporter.log &
#--extend.query-path 指定定义查询文件
打开监控指标页面,此时会出现自定义的指标 如有异常,可以使用 –log.level=debug 参数,检查日志。
对接prometheus
配置prometheus自动发现
在 prometheus.yml 添加以下内容
scrape_configs:
  - job_name: 'udb'
    file_sd_configs:
      - files:
        - "/etc/prometheus/job_discovery/udb.yml"
        refresh_interval: 5s
    relabel_configs:
      - source_labels: [__source__]
        regex: (.*)
        target_label: instance
        replacement: $1
添加目标
/etc/prometheus/job_discovery/udb.yml
- targets: ["192.168.2.70:9190"]
  labels:
    __source__: "192.168.2.81"
- targets: ["192.168.2.70:9191"]
  labels:
    __source__: "192.168.2.82"
重启prometheus
Grafana 图形展示
导入Dashboards 模板
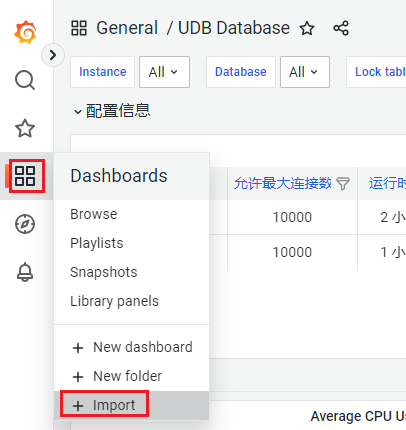
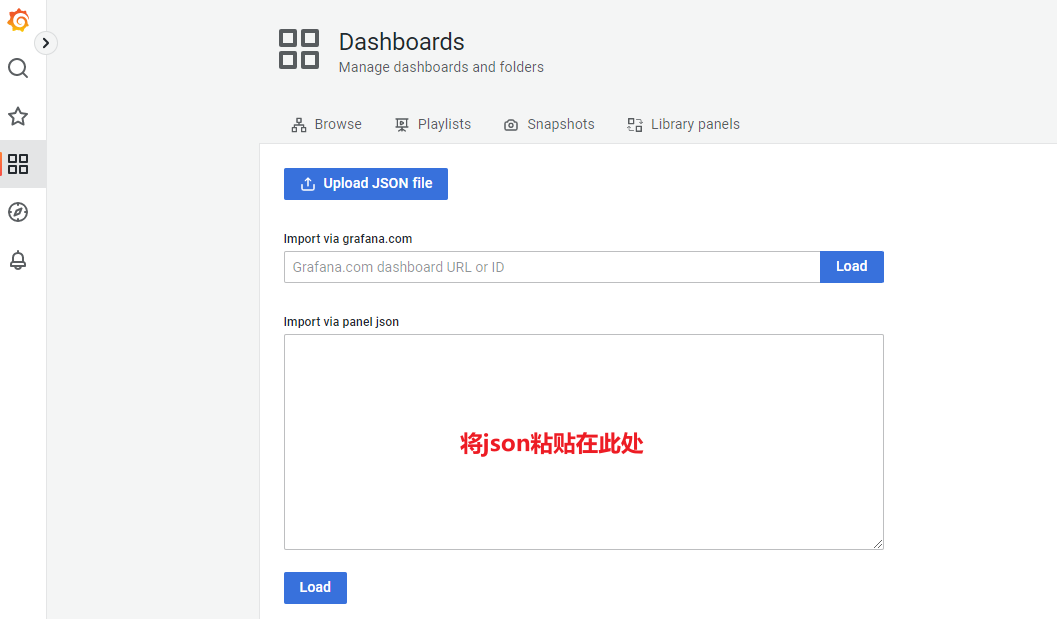
注: 以下模板是在Grafana v9.2.1 创建,不同版本可能存在兼容性。 从pdf复制时,在分页处可能会导致json格式错乱。可使用附件中的json文件。
{
"__inputs": [
{
"name": "DS_PROMETHEUS",
"label": "DS_PROMETHEUS",
"description": "",
"type": "datasource",
"pluginId": "prometheus",
"pluginName": "Prometheus"
}
],
"__requires": [
{
"type": "grafana",
"id": "grafana",
"name": "Grafana",
"version": "6.3.5"
},
{
"type": "panel",
"id": "graph",
"name": "Graph",
"version": ""
},
{
"type": "datasource",
"id": "prometheus",
"name": "Prometheus",
"version": "1.0.0"
},
{
"type": "panel",
"id": "singlestat",
"name": "Singlestat",
"version": ""
}
],
"annotations": {
"list": [
{
"builtIn": 1,
"datasource": {
"type": "datasource",
"uid": "grafana"
},
"enable": true,
"hide": true,
"iconColor": "rgba(0, 211, 255, 1)",
"name": "Annotations & Alerts",
"target": {
"limit": 100,
"matchAny": false,
"tags": [],
"type": "dashboard"
},
"type": "dashboard"
}
]
},
"description": "This dashboard works with postgres_exporter for prometheus",
"editable": true,
"fiscalYearStartMonth": 0,
"gnetId": 9628,
"graphTooltip": 0,
"id": 16,
"links": [],
"liveNow": false,
"panels": [
{
"collapsed": true,
"gridPos": {
"h": 1,
"w": 24,
"x": 0,
"y": 0
},
"id": 96,
"panels": [
{
"datasource": "${DS_PROMETHEUS}",
"fieldConfig": {
"defaults": {
"color": {
"mode": "thresholds"
},
"mappings": [
{
"options": {
"match": "null",
"result": {
"text": "N/A"
}
},
"type": "special"
}
],
"thresholds": {
"mode": "absolute",
"steps": [
{
"color": "green"
},
{
"color": "red",
"value": 80
}
]
},
"unit": "none"
},
"overrides": []
},
"gridPos": {
"h": 2,
"w": 6,
"x": 0,
"y": 1
},
"id": 36,
"links": [],
"maxDataPoints": 100,
"options": {
"colorMode": "value",
"graphMode": "none",
"justifyMode": "auto",
"orientation": "horizontal",
"reduceOptions": {
"calcs": [
"mean"
],
"fields": "",
"values": false
},
"textMode": "name"
},
"pluginVersion": "9.2.1",
"targets": [
{
"datasource": "${DS_PROMETHEUS}",
"expr": "pg_static{release=\"$release\", instance=\"$instance\"}",
"format": "time_series",
"instant": true,
"intervalFactor": 1,
"legendFormat": "{{short_version}}",
"refId": "A"
}
],
"title": "版本号",
"type": "stat"
},
{
"datasource": "${DS_PROMETHEUS}",
"description": "",
"fieldConfig": {
"defaults": {
"color": {
"mode": "thresholds"
},
"mappings": [
{
"options": {
"match": "null",
"result": {
"text": "N/A"
}
},
"type": "special"
}
],
"thresholds": {
"mode": "absolute",
"steps": [
{
"color": "green"
},
{
"color": "red",
"value": 80
}
]
},
"unit": "dateTimeFromNow"
},
"overrides": []
},
"gridPos": {
"h": 2,
"w": 6,
"x": 6,
"y": 1
},
"id": 28,
"links": [],
"maxDataPoints": 100,
"options": {
"colorMode": "none",
"graphMode": "none",
"justifyMode": "auto",
"orientation": "horizontal",
"reduceOptions": {
"calcs": [
"mean"
],
"fields": "",
"values": false
},
"textMode": "auto"
},
"pluginVersion": "9.2.1",
"targets": [
{
"datasource": "${DS_PROMETHEUS}",
"expr": "pg_postmaster_start_time_seconds{release=\"$release\", instance=\"$instance\"} * 1000",
"format": "time_series",
"intervalFactor": 2,
"legendFormat": "",
"refId": "A"
}
],
"title": "运行时长",
"type": "stat"
},
{
"datasource": "${DS_PROMETHEUS}",
"description": "空闲事务总数",
"fieldConfig": {
"defaults": {
"color": {
"mode": "thresholds"
},
"mappings": [
{
"options": {
"match": "null",
"result": {
"text": "N/A"
}
},
"type": "special"
}
],
"thresholds": {
"mode": "absolute",
"steps": [
{
"color": "#299c46"
},
{
"color": "rgba(237, 129, 40, 0.89)",
"value": 0
},
{
"color": "#d44a3a",
"value": 5
}
]
},
"unit": "none"
},
"overrides": []
},
"gridPos": {
"h": 2,
"w": 6,
"x": 12,
"y": 1
},
"id": 78,
"links": [],
"maxDataPoints": 100,
"options": {
"colorMode": "background",
"graphMode": "none",
"justifyMode": "auto",
"orientation": "horizontal",
"reduceOptions": {
"calcs": [
"lastNotNull"
],
"fields": "",
"values": false
},
"textMode": "auto"
},
"pluginVersion": "9.2.1",
"targets": [
{
"datasource": "${DS_PROMETHEUS}",
"editorMode": "code",
"expr": "sum(pg_stat_activity_count{instance=\"$instance\",state=\"idle in transaction\"})",
"hide": false,
"intervalFactor": 1,
"legendFormat": "idle in transaction sessions",
"range": true,
"refId": "C",
"step": 2
}
],
"title": "Count idle in transaction",
"type": "stat"
},
{
"datasource": "${DS_PROMETHEUS}",
"fieldConfig": {
"defaults": {
"color": {
"mode": "thresholds"
},
"mappings": [
{
"options": {
"match": "null",
"result": {
"text": "N/A"
}
},
"type": "special"
}
],
"thresholds": {
"mode": "absolute",
"steps": [
{
"color": "#299c46"
},
{
"color": "rgba(237, 129, 40, 0.89)",
"value": 10
},
{
"color": "#d44a3a",
"value": 25
}
]
},
"unit": "none"
},
"overrides": []
},
"gridPos": {
"h": 2,
"w": 6,
"x": 18,
"y": 1
},
"id": 80,
"links": [],
"maxDataPoints": 100,
"options": {
"colorMode": "background",
"graphMode": "none",
"justifyMode": "auto",
"orientation": "horizontal",
"reduceOptions": {
"calcs": [
"lastNotNull"
],
"fields": "",
"values": false
},
"textMode": "auto"
},
"pluginVersion": "9.2.1",
"targets": [
{
"aggregation": "Last",
"datasource": "${DS_PROMETHEUS}",
"decimals": 2,
"displayAliasType": "Warning / Critical",
"displayType": "Regular",
"displayValueWithAlias": "Never",
"editorMode": "code",
"expr": "sum(pg_locks_count{datname=~\"$datname\", instance=~\"$instance\", mode=~\"$mode\", mode!=\"accesssharelock\", mode!=\"rowsharelock\", mode!=\"sharelock\"} > 1)",
"format": "time_series",
"intervalFactor": 1,
"legendFormat": "{{datname}} {{mode}}",
"range": true,
"refId": "A",
"units": "none",
"valueHandler": "Number Threshold"
}
],
"title": "Sum ExclusiveLock on instance",
"type": "stat"
},
{
"datasource": "${DS_PROMETHEUS}",
"fieldConfig": {
"defaults": {
"color": {
"mode": "thresholds"
},
"mappings": [
{
"options": {
"match": "null",
"result": {
"text": "N/A"
}
},
"type": "special"
}
],
"thresholds": {
"mode": "absolute",
"steps": [
{
"color": "#d44a3a"
},
{
"color": "rgba(237, 129, 40, 0.89)",
"value": 70
},
{
"color": "#299c46",
"value": 80
}
]
},
"unit": "percent"
},
"overrides": []
},
"gridPos": {
"h": 2,
"w": 6,
"x": 0,
"y": 3
},
"id": 82,
"links": [],
"maxDataPoints": 100,
"options": {
"colorMode": "background",
"graphMode": "none",
"justifyMode": "auto",
"orientation": "horizontal",
"reduceOptions": {
"calcs": [
"lastNotNull"
],
"fields": "",
"values": false
},
"textMode": "auto"
},
"pluginVersion": "9.2.1",
"targets": [
{
"datasource": "${DS_PROMETHEUS}",
"expr": "round(100*sum(pg_stat_database_blks_hit{instance=\"$instance\"}) / (sum(pg_stat_database_blks_hit{instance=\"$instance\"}) + sum(pg_stat_database_blks_read{instance=\"$instance\"})),0.1)",
"hide": false,
"interval": "",
"intervalFactor": 2,
"legendFormat": "pg cache hit rate",
"refId": "A",
"step": 2
}
],
"title": "缓冲区命中率",
"type": "stat"
},
{
"datasource": "${DS_PROMETHEUS}",
"description": "如果此占比较高,说明有较多事务被回滚",
"fieldConfig": {
"defaults": {
"color": {
"mode": "thresholds"
},
"mappings": [
{
"options": {
"match": "null",
"result": {
"text": "N/A"
}
},
"type": "special"
}
],
"thresholds": {
"mode": "absolute",
"steps": [
{
"color": "#299c46"
},
{
"color": "rgba(237, 129, 40, 0.89)",
"value": 5
},
{
"color": "#d44a3a",
"value": 10
}
]
},
"unit": "percent"
},
"overrides": []
},
"gridPos": {
"h": 2,
"w": 6,
"x": 6,
"y": 3
},
"id": 76,
"links": [],
"maxDataPoints": 100,
"options": {
"colorMode": "background",
"graphMode": "none",
"justifyMode": "auto",
"orientation": "horizontal",
"reduceOptions": {
"calcs": [
"lastNotNull"
],
"fields": "",
"values": false
},
"textMode": "auto"
},
"pluginVersion": "9.2.1",
"targets": [
{
"datasource": "${DS_PROMETHEUS}",
"expr": "(sum(pg_stat_database_xact_rollback{instance=\"$instance\"})/sum(pg_stat_database_xact_commit{instance=\"$instance\"}))*100",
"format": "time_series",
"hide": false,
"intervalFactor": 1,
"legendFormat": "",
"refId": "A"
}
],
"title": "回滚/提交事务占比",
"type": "stat"
},
{
"datasource": "${DS_PROMETHEUS}",
"fieldConfig": {
"defaults": {
"color": {
"mode": "thresholds"
},
"mappings": [
{
"options": {
"match": "null",
"result": {
"text": "N/A"
}
},
"type": "special"
}
],
"thresholds": {
"mode": "absolute",
"steps": [
{
"color": "#299c46"
},
{
"color": "rgba(237, 129, 40, 0.89)",
"value": 10
},
{
"color": "#d44a3a",
"value": 20
}
]
},
"unit": "none"
},
"overrides": []
},
"gridPos": {
"h": 2,
"w": 6,
"x": 12,
"y": 3
},
"id": 86,
"links": [],
"maxDataPoints": 100,
"options": {
"colorMode": "background",
"graphMode": "none",
"justifyMode": "auto",
"orientation": "horizontal",
"reduceOptions": {
"calcs": [
"lastNotNull"
],
"fields": "",
"values": false
},
"textMode": "auto"
},
"pluginVersion": "9.2.1",
"targets": [
{
"datasource": "${DS_PROMETHEUS}",
"editorMode": "code",
"expr": "(sum(rate(pg_stat_database_xact_rollback{instance=\"$instance\"}[1m])) + sum(rate(pg_stat_database_xact_commit{instance=\"$instance\"}[1m])))/60",
"format": "time_series",
"hide": false,
"intervalFactor": 1,
"legendFormat": "TPS",
"range": true,
"refId": "A"
}
],
"title": "每秒事务数",
"type": "stat"
},
{
"datasource": "${DS_PROMETHEUS}",
"fieldConfig": {
"defaults": {
"color": {
"mode": "thresholds"
},
"mappings": [
{
"options": {
"match": "null",
"result": {
"text": "N/A"
}
},
"type": "special"
}
],
"thresholds": {
"mode": "absolute",
"steps": [
{
"color": "#299c46"
},
{
"color": "rgba(237, 129, 40, 0.89)",
"value": 4
},
{
"color": "#d44a3a",
"value": 6
}
]
},
"unit": "none"
},
"overrides": []
},
"gridPos": {
"h": 2,
"w": 6,
"x": 18,
"y": 3
},
"id": 88,
"links": [],
"maxDataPoints": 100,
"options": {
"colorMode": "background",
"graphMode": "none",
"justifyMode": "auto",
"orientation": "horizontal",
"reduceOptions": {
"calcs": [
"lastNotNull"
],
"fields": "",
"values": false
},
"textMode": "auto"
},
"pluginVersion": "9.2.1",
"targets": [
{
"aggregation": "Last",
"datasource": "${DS_PROMETHEUS}",
"decimals": 2,
"displayAliasType": "Warning / Critical",
"displayType": "Regular",
"displayValueWithAlias": "Never",
"expr": "sum(pg_locks_count{datname=~\"$datname\", datname!=\"postgres\", instance=~\"$instance\", mode=~\"$mode\", mode!=\"accessexclusivelock\", mode!=\"exclusivelock\", mode!=\"rowexclusivelock\", mode!=\"sharerowexclusivelock\", mode!=\"shareupdateexclusivelock\" })",
"format": "time_series",
"intervalFactor": 1,
"legendFormat": "",
"refId": "A",
"units": "none",
"valueHandler": "Number Threshold"
}
],
"title": "Sum ShareLock on instance",
"type": "stat"
},
{
"datasource": "${DS_PROMETHEUS}",
"fieldConfig": {
"defaults": {
"color": {
"mode": "thresholds"
},
"mappings": [
{
"options": {
"match": "null",
"result": {
"text": "N/A"
}
},
"type": "special"
}
],
"thresholds": {
"mode": "absolute",
"steps": [
{
"color": "#299c46"
},
{
"color": "rgba(237, 129, 40, 0.89)",
"value": 10
},
{
"color": "#d44a3a",
"value": 20
}
]
},
"unit": "none"
},
"overrides": []
},
"gridPos": {
"h": 2,
"w": 6,
"x": 0,
"y": 5
},
"id": 90,
"links": [],
"maxDataPoints": 100,
"options": {
"colorMode": "background",
"graphMode": "none",
"justifyMode": "auto",
"orientation": "horizontal",
"reduceOptions": {
"calcs": [
"lastNotNull"
],
"fields": "",
"values": false
},
"textMode": "auto"
},
"pluginVersion": "9.2.1",
"targets": [
{
"datasource": "${DS_PROMETHEUS}",
"editorMode": "code",
"expr": "sum(rate(pg_stat_statements_calls{instance=~\"$instance\"}[1m]))/60",
"format": "time_series",
"intervalFactor": 2,
"legendFormat": "",
"range": true,
"refId": "A"
}
],
"title": "Queries per second",
"type": "stat"
},
{
"datasource": "${DS_PROMETHEUS}",
"fieldConfig": {
"defaults": {
"color": {
"mode": "thresholds"
},
"mappings": [
{
"options": {
"match": "null",
"result": {
"text": "N/A"
}
},
"type": "special"
}
],
"thresholds": {
"mode": "absolute",
"steps": [
{
"color": "#299c46"
},
{
"color": "rgba(237, 129, 40, 0.89)",
"value": 75
},
{
"color": "#d44a3a",
"value": 85
}
]
},
"unit": "percent"
},
"overrides": []
},
"gridPos": {
"h": 2,
"w": 6,
"x": 6,
"y": 5
},
"id": 84,
"links": [],
"maxDataPoints": 100,
"options": {
"colorMode": "background",
"graphMode": "none",
"justifyMode": "auto",
"orientation": "horizontal",
"reduceOptions": {
"calcs": [
"lastNotNull"
],
"fields": "",
"values": false
},
"textMode": "auto"
},
"pluginVersion": "9.2.1",
"targets": [
{
"datasource": "${DS_PROMETHEUS}",
"expr": "(sum(pg_stat_activity_count{instance=\"$instance\"}) / sum(pg_settings_max_connections)) * 100",
"hide": false,
"interval": "",
"intervalFactor": 1,
"legendFormat": "total/all connection",
"metric": "pg_runtime_variable_max_connections",
"refId": "A",
"step": 2
}
],
"title": "% current/total connections",
"type": "stat"
},
{
"datasource": "${DS_PROMETHEUS}",
"description": "Connected sessions, including Postgres internal processes like Autovacuum. < 1 Warn / > 300 Error thresholds by default",
"fieldConfig": {
"defaults": {
"color": {
"mode": "thresholds"
},
"mappings": [
{
"options": {
"match": "null",
"result": {
"text": "N/A"
}
},
"type": "special"
}
],
"thresholds": {
"mode": "absolute",
"steps": [
{
"color": "#299c46"
},
{
"color": "rgba(237, 129, 40, 0.89)",
"value": 1
},
{
"color": "#d44a3a",
"value": 300
}
]
},
"unit": "none"
},
"overrides": []
},
"gridPos": {
"h": 2,
"w": 6,
"x": 12,
"y": 5
},
"id": 94,
"links": [],
"maxDataPoints": 100,
"options": {
"colorMode": "background",
"graphMode": "none",
"justifyMode": "auto",
"orientation": "horizontal",
"reduceOptions": {
"calcs": [
"lastNotNull"
],
"fields": "",
"values": false
},
"textMode": "auto"
},
"pluginVersion": "9.2.1",
"targets": [
{
"datasource": "${DS_PROMETHEUS}",
"expr": "sum(pg_stat_activity_count{state=\"active\"})",
"format": "time_series",
"interval": "",
"intervalFactor": 2,
"legendFormat": "",
"refId": "A",
"step": 2
}
],
"title": "Active sessions",
"type": "stat"
},
{
"datasource": "${DS_PROMETHEUS}",
"fieldConfig": {
"defaults": {
"color": {
"mode": "thresholds"
},
"mappings": [
{
"options": {
"match": "null",
"result": {
"text": "N/A"
}
},
"type": "special"
}
],
"thresholds": {
"mode": "absolute",
"steps": [
{
"color": "#299c46"
},
{
"color": "rgba(237, 129, 40, 0.89)",
"value": 1
},
{
"color": "#d44a3a",
"value": 2
}
]
},
"unit": "none"
},
"overrides": []
},
"gridPos": {
"h": 2,
"w": 6,
"x": 18,
"y": 5
},
"id": 92,
"links": [],
"maxDataPoints": 100,
"options": {
"colorMode": "background",
"graphMode": "none",
"justifyMode": "auto",
"orientation": "horizontal",
"reduceOptions": {
"calcs": [
"lastNotNull"
],
"fields": "",
"values": false
},
"textMode": "auto"
},
"pluginVersion": "9.2.1",
"targets": [
{
"datasource": "${DS_PROMETHEUS}",
"editorMode": "code",
"expr": "sum(rate(pg_stat_statements_mean_time_seconds{datname!~\"template.*\", instance=~\"$instance\"}[1m]))",
"format": "time_series",
"intervalFactor": 2,
"legendFormat": "",
"range": true,
"refId": "A"
}
],
"title": "Mean query time avg 1m by instance",
"type": "stat"
},
{
"datasource": "${DS_PROMETHEUS}",
"fieldConfig": {
"defaults": {
"color": {
"fixedColor": "rgb(31, 120, 193)",
"mode": "fixed"
},
"decimals": 0,
"mappings": [
{
"options": {
"match": "null",
"result": {
"text": "N/A"
}
},
"type": "special"
}
],
"thresholds": {
"mode": "absolute",
"steps": [
{
"color": "green"
},
{
"color": "red",
"value": 80
}
]
},
"unit": "none"
},
"overrides": []
},
"gridPos": {
"h": 5,
"w": 12,
"x": 0,
"y": 7
},
"id": 72,
"links": [],
"maxDataPoints": 100,
"options": {
"colorMode": "none",
"graphMode": "area",
"justifyMode": "auto",
"orientation": "horizontal",
"reduceOptions": {
"calcs": [
"mean"
],
"fields": "",
"values": false
},
"textMode": "auto"
},
"pluginVersion": "9.2.1",
"targets": [
{
"datasource": "${DS_PROMETHEUS}",
"dsType": "prometheus",
"editorMode": "code",
"exemplar": false,
"expr": "sum(irate(pg_stat_database_xact_commit{datname=~\"$datname\",instance=~\"$instance\"}[5m])) + sum(irate(pg_stat_database_xact_rollback{datname=~\"$datname\",instance=~\"$instance\"}[5m]))",
"format": "table",
"groupBy": [
{
"params": [
"$interval"
],
"type": "time"
},
{
"params": [
"null"
],
"type": "fill"
}
],
"instant": true,
"interval": "",
"intervalFactor": 2,
"legendFormat": "",
"measurement": "postgresql",
"policy": "default",
"range": true,
"refId": "A",
"resultFormat": "time_series",
"select": [
[
{
"params": [
"xact_commit"
],
"type": "field"
},
{
"params": [],
"type": "mean"
},
{
"params": [
"10s"
],
"type": "non_negative_derivative"
}
]
],
"step": 1800,
"tags": [
{
"key": "host",
"operator": "=~",
"value": "/^$host$/"
}
]
}
],
"title": "TPS",
"transparent": true,
"type": "stat"
},
{
"datasource": "${DS_PROMETHEUS}",
"fieldConfig": {
"defaults": {
"color": {
"fixedColor": "rgb(31, 120, 193)",
"mode": "fixed"
},
"decimals": 0,
"mappings": [
{
"options": {
"match": "null",
"result": {
"text": "N/A"
}
},
"type": "special"
}
],
"thresholds": {
"mode": "absolute",
"steps": [
{
"color": "green"
},
{
"color": "red",
"value": 80
}
]
},
"unit": "none"
},
"overrides": []
},
"gridPos": {
"h": 5,
"w": 12,
"x": 12,
"y": 7
},
"id": 97,
"links": [],
"maxDataPoints": 100,
"options": {
"colorMode": "none",
"graphMode": "area",
"justifyMode": "auto",
"orientation": "horizontal",
"reduceOptions": {
"calcs": [
"mean"
],
"fields": "",
"values": false
},
"textMode": "auto"
},
"pluginVersion": "9.2.1",
"targets": [
{
"datasource": "${DS_PROMETHEUS}",
"dsType": "prometheus",
"editorMode": "code",
"expr": "sum(irate(pg_stat_database_tup_fetched{datname=~\"$datname\",instance=~\"$instance\"}[5m]))",
"format": "time_series",
"groupBy": [
{
"params": [
"$interval"
],
"type": "time"
},
{
"params": [
"null"
],
"type": "fill"
}
],
"intervalFactor": 2,
"measurement": "postgresql",
"policy": "default",
"range": true,
"refId": "A",
"resultFormat": "time_series",
"select": [
[
{
"params": [
"xact_commit"
],
"type": "field"
},
{
"params": [],
"type": "mean"
},
{
"params": [
"10s"
],
"type": "non_negative_derivative"
}
]
],
"step": 1800,
"tags": [
{
"key": "host",
"operator": "=~",
"value": "/^$host$/"
}
]
}
],
"title": "QPS",
"transparent": true,
"type": "stat"
}
],
"title": "概览",
"type": "row"
},
{
"collapsed": true,
"datasource": "${DS_PROMETHEUS}",
"gridPos": {
"h": 1,
"w": 24,
"x": 0,
"y": 1
},
"id": 34,
"panels": [
{
"datasource": "${DS_PROMETHEUS}",
"fieldConfig": {
"defaults": {
"color": {
"mode": "thresholds"
},
"mappings": [
{
"options": {
"match": "null",
"result": {
"text": "N/A"
}
},
"type": "special"
}
],
"thresholds": {
"mode": "absolute",
"steps": [
{
"color": "green",
"value": null
},
{
"color": "red",
"value": 80
}
]
},
"unit": "decbytes"
},
"overrides": []
},
"gridPos": {
"h": 2,
"w": 5,
"x": 0,
"y": 2
},
"id": 11,
"links": [],
"maxDataPoints": 100,
"options": {
"colorMode": "none",
"graphMode": "none",
"justifyMode": "auto",
"orientation": "horizontal",
"reduceOptions": {
"calcs": [
"lastNotNull"
],
"fields": "",
"values": false
},
"textMode": "auto"
},
"pluginVersion": "9.2.1",
"targets": [
{
"datasource": "${DS_PROMETHEUS}",
"expr": "SUM(pg_stat_database_tup_inserted{release=\"$release\", datname=~\"$datname\", instance=~\"$instance\"})",
"format": "time_series",
"intervalFactor": 2,
"refId": "A",
"step": 4
}
],
"title": "插入数据行数",
"type": "stat"
},
{
"datasource": "${DS_PROMETHEUS}",
"fieldConfig": {
"defaults": {
"color": {
"mode": "thresholds"
},
"mappings": [
{
"options": {
"match": "null",
"result": {
"text": "N/A"
}
},
"type": "special"
}
],
"thresholds": {
"mode": "absolute",
"steps": [
{
"color": "green",
"value": null
},
{
"color": "red",
"value": 80
}
]
},
"unit": "decbytes"
},
"overrides": []
},
"gridPos": {
"h": 2,
"w": 5,
"x": 5,
"y": 2
},
"id": 99,
"links": [],
"maxDataPoints": 100,
"options": {
"colorMode": "none",
"graphMode": "none",
"justifyMode": "auto",
"orientation": "horizontal",
"reduceOptions": {
"calcs": [
"lastNotNull"
],
"fields": "",
"values": false
},
"textMode": "auto"
},
"pluginVersion": "9.2.1",
"targets": [
{
"datasource": "${DS_PROMETHEUS}",
"editorMode": "code",
"expr": "SUM(pg_stat_database_tup_deleted{release=\"$release\", datname=~\"$datname\", instance=~\"$instance\"})",
"format": "time_series",
"intervalFactor": 2,
"range": true,
"refId": "A",
"step": 4
}
],
"title": "删除数据行数",
"type": "stat"
},
{
"datasource": "${DS_PROMETHEUS}",
"fieldConfig": {
"defaults": {
"color": {
"mode": "thresholds"
},
"mappings": [
{
"options": {
"match": "null",
"result": {
"text": "N/A"
}
},
"type": "special"
}
],
"thresholds": {
"mode": "absolute",
"steps": [
{
"color": "green",
"value": null
},
{
"color": "red",
"value": 80
}
]
},
"unit": "decbytes"
},
"overrides": []
},
"gridPos": {
"h": 2,
"w": 5,
"x": 10,
"y": 2
},
"id": 12,
"links": [],
"maxDataPoints": 100,
"options": {
"colorMode": "none",
"graphMode": "none",
"justifyMode": "auto",
"orientation": "horizontal",
"reduceOptions": {
"calcs": [
"lastNotNull"
],
"fields": "",
"values": false
},
"textMode": "auto"
},
"pluginVersion": "9.2.1",
"targets": [
{
"datasource": "${DS_PROMETHEUS}",
"editorMode": "code",
"expr": "SUM(pg_stat_database_tup_updated{datname=~\"$datname\", instance=~\"$instance\"})",
"format": "time_series",
"intervalFactor": 2,
"range": true,
"refId": "A",
"step": 4
}
],
"title": "更新数据行数",
"type": "stat"
},
{
"datasource": "${DS_PROMETHEUS}",
"description": "通过索引指向的tid去回表访问的行数。\n如果返回数远大于获取数,则说明发生比较多的全表扫描。",
"fieldConfig": {
"defaults": {
"color": {
"mode": "thresholds"
},
"mappings": [
{
"options": {
"match": "null",
"result": {
"text": "N/A"
}
},
"type": "special"
}
],
"thresholds": {
"mode": "absolute",
"steps": [
{
"color": "green",
"value": null
},
{
"color": "red",
"value": 80
}
]
},
"unit": "decbytes"
},
"overrides": []
},
"gridPos": {
"h": 2,
"w": 5,
"x": 15,
"y": 2
},
"id": 98,
"links": [],
"maxDataPoints": 100,
"options": {
"colorMode": "none",
"graphMode": "none",
"justifyMode": "auto",
"orientation": "horizontal",
"reduceOptions": {
"calcs": [
"lastNotNull"
],
"fields": "",
"values": false
},
"textMode": "auto"
},
"pluginVersion": "9.2.1",
"targets": [
{
"datasource": "${DS_PROMETHEUS}",
"expr": "SUM(pg_stat_database_tup_fetched{datname=~\"$datname\", instance=~\"$instance\"})",
"format": "time_series",
"intervalFactor": 2,
"refId": "A",
"step": 4
}
],
"title": "查询获取数",
"type": "stat"
},
{
"datasource": "${DS_PROMETHEUS}",
"description": "直接扫描表的总行数 + 直接扫描索引的索引条目数。\n如果返回数远大于获取数,则说明发生比较多的全表扫描。",
"fieldConfig": {
"defaults": {
"color": {
"mode": "thresholds"
},
"mappings": [
{
"options": {
"match": "null",
"result": {
"text": "N/A"
}
},
"type": "special"
}
],
"thresholds": {
"mode": "absolute",
"steps": [
{
"color": "green",
"value": null
},
{
"color": "red",
"value": 80
}
]
},
"unit": "decbytes"
},
"overrides": []
},
"gridPos": {
"h": 2,
"w": 4,
"x": 20,
"y": 2
},
"id": 10,
"links": [],
"maxDataPoints": 100,
"options": {
"colorMode": "none",
"graphMode": "none",
"justifyMode": "auto",
"orientation": "horizontal",
"reduceOptions": {
"calcs": [
"lastNotNull"
],
"fields": "",
"values": false
},
"textMode": "auto"
},
"pluginVersion": "9.2.1",
"targets": [
{
"datasource": "${DS_PROMETHEUS}",
"editorMode": "code",
"expr": "SUM(pg_stat_database_tup_returned{datname=~\"$datname\", instance=~\"$instance\"})",
"format": "time_series",
"intervalFactor": 2,
"range": true,
"refId": "A",
"step": 4
}
],
"title": "查询返回数",
"type": "stat"
},
{
"datasource": "${DS_PROMETHEUS}",
"fieldConfig": {
"defaults": {
"color": {
"mode": "thresholds"
},
"mappings": [
{
"options": {
"match": "null",
"result": {
"text": "N/A"
}
},
"type": "special"
}
],
"thresholds": {
"mode": "absolute",
"steps": [
{
"color": "green",
"value": null
},
{
"color": "red",
"value": 80
}
]
},
"unit": "none"
},
"overrides": []
},
"gridPos": {
"h": 2,
"w": 4,
"x": 0,
"y": 4
},
"id": 38,
"links": [],
"maxDataPoints": 100,
"options": {
"colorMode": "none",
"graphMode": "none",
"justifyMode": "auto",
"orientation": "horizontal",
"reduceOptions": {
"calcs": [
"mean"
],
"fields": "",
"values": false
},
"textMode": "auto"
},
"pluginVersion": "9.2.1",
"targets": [
{
"datasource": "${DS_PROMETHEUS}",
"expr": "pg_settings_max_connections{release=\"$release\", instance=\"$instance\"}",
"format": "time_series",
"intervalFactor": 1,
"refId": "A"
}
],
"title": "最大允许连接数",
"type": "stat"
},
{
"datasource": "${DS_PROMETHEUS}",
"fieldConfig": {
"defaults": {
"color": {
"mode": "thresholds"
},
"mappings": [
{
"options": {
"match": "null",
"result": {
"text": "N/A"
}
},
"type": "special"
}
],
"thresholds": {
"mode": "absolute",
"steps": [
{
"color": "green",
"value": null
},
{
"color": "red",
"value": 80
}
]
},
"unit": "none"
},
"overrides": []
},
"gridPos": {
"h": 2,
"w": 4,
"x": 4,
"y": 4
},
"id": 100,
"links": [],
"maxDataPoints": 100,
"options": {
"colorMode": "none",
"graphMode": "none",
"justifyMode": "auto",
"orientation": "horizontal",
"reduceOptions": {
"calcs": [
"mean"
],
"fields": "",
"values": false
},
"textMode": "auto"
},
"pluginVersion": "9.2.1",
"targets": [
{
"datasource": "${DS_PROMETHEUS}",
"editorMode": "code",
"exemplar": false,
"expr": "SUM(pg_stat_activity_count{datname=~\"$datname\", instance=~\"$instance\",state=\"active\"})",
"format": "time_series",
"instant": true,
"intervalFactor": 1,
"range": false,
"refId": "A"
}
],
"title": "活动连接数",
"type": "stat"
},
{
"datasource": "${DS_PROMETHEUS}",
"fieldConfig": {
"defaults": {
"color": {
"mode": "thresholds"
},
"mappings": [
{
"options": {
"match": "null",
"result": {
"text": "N/A"
}
},
"type": "special"
}
],
"thresholds": {
"mode": "absolute",
"steps": [
{
"color": "green",
"value": null
},
{
"color": "red",
"value": 80
}
]
},
"unit": "none"
},
"overrides": []
},
"gridPos": {
"h": 2,
"w": 4,
"x": 8,
"y": 4
},
"id": 101,
"links": [],
"maxDataPoints": 100,
"options": {
"colorMode": "none",
"graphMode": "none",
"justifyMode": "auto",
"orientation": "horizontal",
"reduceOptions": {
"calcs": [
"mean"
],
"fields": "",
"values": false
},
"textMode": "auto"
},
"pluginVersion": "9.2.1",
"targets": [
{
"datasource": "${DS_PROMETHEUS}",
"editorMode": "code",
"exemplar": false,
"expr": "SUM(pg_stat_activity_count{datname=~\"$datname\", instance=~\"$instance\",state=\"idle\"})",
"format": "time_series",
"instant": true,
"intervalFactor": 1,
"range": false,
"refId": "A"
}
],
"title": "空闲连接数",
"type": "stat"
},
{
"datasource": "${DS_PROMETHEUS}",
"fieldConfig": {
"defaults": {
"color": {
"mode": "thresholds"
},
"mappings": [
{
"options": {
"match": "null",
"result": {
"text": "N/A"
}
},
"type": "special"
}
],
"thresholds": {
"mode": "absolute",
"steps": [
{
"color": "green",
"value": null
},
{
"color": "red",
"value": 80
}
]
},
"unit": "none"
},
"overrides": []
},
"gridPos": {
"h": 2,
"w": 4,
"x": 12,
"y": 4
},
"id": 103,
"links": [],
"maxDataPoints": 100,
"options": {
"colorMode": "none",
"graphMode": "none",
"justifyMode": "auto",
"orientation": "horizontal",
"reduceOptions": {
"calcs": [
"mean"
],
"fields": "",
"values": false
},
"textMode": "auto"
},
"pluginVersion": "9.2.1",
"targets": [
{
"datasource": "${DS_PROMETHEUS}",
"editorMode": "code",
"exemplar": false,
"expr": "SUM(pg_stat_activity_count{datname=~\"$datname\", instance=~\"$instance\",state=\"idle in transaction\"})",
"format": "time_series",
"instant": true,
"intervalFactor": 1,
"range": false,
"refId": "A"
}
],
"title": "空闲事务连接数",
"type": "stat"
},
{
"datasource": "${DS_PROMETHEUS}",
"description": "表示进程处于一个事务中,该事务存在语句错误,并且进程当前没有执行查询操作。",
"fieldConfig": {
"defaults": {
"color": {
"mode": "thresholds"
},
"mappings": [
{
"options": {
"match": "null",
"result": {
"text": "N/A"
}
},
"type": "special"
}
],
"thresholds": {
"mode": "absolute",
"steps": [
{
"color": "green",
"value": null
},
{
"color": "red",
"value": 80
}
]
},
"unit": "none"
},
"overrides": []
},
"gridPos": {
"h": 2,
"w": 4,
"x": 16,
"y": 4
},
"id": 102,
"links": [],
"maxDataPoints": 100,
"options": {
"colorMode": "none",
"graphMode": "none",
"justifyMode": "auto",
"orientation": "horizontal",
"reduceOptions": {
"calcs": [
"mean"
],
"fields": "",
"values": false
},
"textMode": "auto"
},
"pluginVersion": "9.2.1",
"targets": [
{
"datasource": "${DS_PROMETHEUS}",
"editorMode": "code",
"exemplar": false,
"expr": "SUM(pg_stat_activity_count{datname=~\"$datname\", instance=~\"$instance\",state=\"idle in transaction (aborted)\"})",
"format": "time_series",
"instant": true,
"intervalFactor": 1,
"range": false,
"refId": "A"
}
],
"title": "空闲事务退出连接数",
"type": "stat"
},
{
"datasource": "${DS_PROMETHEUS}",
"description": "快速通道函数调用",
"fieldConfig": {
"defaults": {
"color": {
"mode": "thresholds"
},
"mappings": [
{
"options": {
"match": "null",
"result": {
"text": "N/A"
}
},
"type": "special"
}
],
"thresholds": {
"mode": "absolute",
"steps": [
{
"color": "green",
"value": null
},
{
"color": "red",
"value": 80
}
]
},
"unit": "none"
},
"overrides": []
},
"gridPos": {
"h": 2,
"w": 4,
"x": 20,
"y": 4
},
"id": 104,
"links": [],
"maxDataPoints": 100,
"options": {
"colorMode": "none",
"graphMode": "none",
"justifyMode": "auto",
"orientation": "horizontal",
"reduceOptions": {
"calcs": [
"mean"
],
"fields": "",
"values": false
},
"textMode": "auto"
},
"pluginVersion": "9.2.1",
"targets": [
{
"datasource": "${DS_PROMETHEUS}",
"editorMode": "code",
"exemplar": false,
"expr": "SUM(pg_stat_activity_count{datname=~\"$datname\", instance=~\"$instance\",state=\"fastpath function call\"})",
"format": "time_series",
"instant": true,
"intervalFactor": 1,
"range": false,
"refId": "A"
}
],
"title": "空闲事务连接数",
"type": "stat"
},
{
"aliasColors": {},
"bars": false,
"dashLength": 10,
"dashes": false,
"datasource": "${DS_PROMETHEUS}",
"description": "Average user and system CPU time spent in seconds.",
"fieldConfig": {
"defaults": {
"links": []
},
"overrides": []
},
"fill": 1,
"fillGradient": 0,
"gridPos": {
"h": 7,
"w": 8,
"x": 0,
"y": 6
},
"hiddenSeries": false,
"id": 22,
"legend": {
"alignAsTable": true,
"avg": true,
"current": true,
"max": true,
"min": true,
"show": true,
"total": false,
"values": true
},
"lines": true,
"linewidth": 1,
"links": [],
"nullPointMode": "null",
"options": {
"alertThreshold": true
},
"percentage": false,
"pluginVersion": "9.2.1",
"pointradius": 5,
"points": false,
"renderer": "flot",
"seriesOverrides": [],
"spaceLength": 10,
"stack": false,
"steppedLine": false,
"targets": [
{
"datasource": "${DS_PROMETHEUS}",
"expr": "avg(rate(process_cpu_seconds_total{release=\"$release\", instance=\"$instance\"}[5m]) * 1000)",
"format": "time_series",
"intervalFactor": 2,
"legendFormat": "CPU Time",
"refId": "A"
}
],
"thresholds": [],
"timeRegions": [],
"title": "Average CPU Usage",
"tooltip": {
"shared": true,
"sort": 0,
"value_type": "individual"
},
"type": "graph",
"xaxis": {
"mode": "time",
"show": true,
"values": []
},
"yaxes": [
{
"format": "s",
"logBase": 1,
"show": true
},
{
"format": "short",
"logBase": 1,
"show": true
}
],
"yaxis": {
"align": false
}
},
{
"aliasColors": {},
"bars": false,
"dashLength": 10,
"dashes": false,
"datasource": "${DS_PROMETHEUS}",
"description": "Virtual and Resident memory size in bytes, averages over 5 min interval",
"fieldConfig": {
"defaults": {
"links": []
},
"overrides": []
},
"fill": 1,
"fillGradient": 0,
"gridPos": {
"h": 7,
"w": 8,
"x": 8,
"y": 6
},
"hiddenSeries": false,
"id": 24,
"legend": {
"alignAsTable": true,
"avg": true,
"current": true,
"max": true,
"min": true,
"show": true,
"total": false,
"values": true
},
"lines": true,
"linewidth": 1,
"links": [],
"nullPointMode": "null",
"options": {
"alertThreshold": true
},
"percentage": false,
"pluginVersion": "9.2.1",
"pointradius": 5,
"points": false,
"renderer": "flot",
"seriesOverrides": [],
"spaceLength": 10,
"stack": false,
"steppedLine": false,
"targets": [
{
"datasource": "${DS_PROMETHEUS}",
"expr": "avg(rate(process_resident_memory_bytes{release=\"$release\", instance=\"$instance\"}[5m]))",
"format": "time_series",
"intervalFactor": 2,
"legendFormat": "Resident Mem",
"refId": "A"
},
{
"datasource": "${DS_PROMETHEUS}",
"expr": "avg(rate(process_virtual_memory_bytes{release=\"$release\", instance=\"$instance\"}[5m]))",
"format": "time_series",
"intervalFactor": 2,
"legendFormat": "Virtual Mem",
"refId": "B"
}
],
"thresholds": [],
"timeRegions": [],
"title": "Average Memory Usage",
"tooltip": {
"shared": true,
"sort": 0,
"value_type": "individual"
},
"type": "graph",
"xaxis": {
"mode": "time",
"show": true,
"values": []
},
"yaxes": [
{
"format": "decbytes",
"logBase": 1,
"show": true
},
{
"format": "short",
"logBase": 1,
"show": true
}
],
"yaxis": {
"align": false
}
},
{
"aliasColors": {},
"bars": false,
"dashLength": 10,
"dashes": false,
"datasource": "${DS_PROMETHEUS}",
"description": "Number of open file descriptors",
"fieldConfig": {
"defaults": {
"links": []
},
"overrides": []
},
"fill": 1,
"fillGradient": 0,
"gridPos": {
"h": 7,
"w": 8,
"x": 16,
"y": 6
},
"hiddenSeries": false,
"id": 26,
"legend": {
"alignAsTable": true,
"avg": true,
"current": true,
"max": true,
"min": true,
"show": true,
"total": false,
"values": true
},
"lines": true,
"linewidth": 1,
"links": [],
"nullPointMode": "null",
"options": {
"alertThreshold": true
},
"percentage": false,
"pluginVersion": "9.2.1",
"pointradius": 5,
"points": false,
"renderer": "flot",
"seriesOverrides": [],
"spaceLength": 10,
"stack": false,
"steppedLine": false,
"targets": [
{
"datasource": "${DS_PROMETHEUS}",
"expr": "process_open_fds{release=\"$release\", instance=\"$instance\"}",
"format": "time_series",
"intervalFactor": 2,
"legendFormat": "Open FD",
"refId": "A"
}
],
"thresholds": [],
"timeRegions": [],
"title": "Open File Descriptors",
"tooltip": {
"shared": true,
"sort": 0,
"value_type": "individual"
},
"type": "graph",
"xaxis": {
"mode": "time",
"show": true,
"values": []
},
"yaxes": [
{
"format": "short",
"logBase": 1,
"show": true
},
{
"format": "short",
"logBase": 1,
"show": true
}
],
"yaxis": {
"align": false
}
}
],
"targets": [
{
"datasource": "${DS_PROMETHEUS}",
"refId": "A"
}
],
"title": "连接数,内存,CPU,磁盘信息",
"type": "row"
},
{
"collapsed": true,
"datasource": "${DS_PROMETHEUS}",
"gridPos": {
"h": 1,
"w": 24,
"x": 0,
"y": 2
},
"id": 32,
"panels": [
{
"datasource": "${DS_PROMETHEUS}",
"fieldConfig": {
"defaults": {
"color": {
"mode": "thresholds"
},
"mappings": [
{
"options": {
"match": "null",
"result": {
"text": "N/A"
}
},
"type": "special"
}
],
"thresholds": {
"mode": "absolute",
"steps": [
{
"color": "green",
"value": null
},
{
"color": "red",
"value": 80
}
]
},
"unit": "bytes"
},
"overrides": []
},
"gridPos": {
"h": 3,
"w": 3,
"x": 0,
"y": 3
},
"id": 40,
"links": [],
"maxDataPoints": 100,
"options": {
"colorMode": "none",
"graphMode": "none",
"justifyMode": "auto",
"orientation": "horizontal",
"reduceOptions": {
"calcs": [
"lastNotNull"
],
"fields": "",
"values": false
},
"textMode": "auto"
},
"pluginVersion": "9.2.1",
"targets": [
{
"datasource": "${DS_PROMETHEUS}",
"expr": "pg_settings_shared_buffers_bytes{instance=\"$instance\"}",
"format": "time_series",
"intervalFactor": 1,
"refId": "A"
}
],
"title": "共享缓冲大小",
"type": "stat"
},
{
"datasource": "${DS_PROMETHEUS}",
"description": "用来告诉优化器,系统可以提供多大的cache",
"fieldConfig": {
"defaults": {
"color": {
"mode": "thresholds"
},
"mappings": [
{
"options": {
"match": "null",
"result": {
"text": "N/A"
}
},
"type": "special"
}
],
"thresholds": {
"mode": "absolute",
"steps": [
{
"color": "green",
"value": null
},
{
"color": "red",
"value": 80
}
]
},
"unit": "bytes"
},
"overrides": []
},
"gridPos": {
"h": 3,
"w": 3,
"x": 3,
"y": 3
},
"id": 42,
"links": [],
"maxDataPoints": 100,
"options": {
"colorMode": "none",
"graphMode": "none",
"justifyMode": "auto",
"orientation": "horizontal",
"reduceOptions": {
"calcs": [
"lastNotNull"
],
"fields": "",
"values": false
},
"textMode": "auto"
},
"pluginVersion": "9.2.1",
"targets": [
{
"datasource": "${DS_PROMETHEUS}",
"editorMode": "code",
"expr": "pg_settings_effective_cache_size_bytes{instance=\"$instance\"}",
"format": "time_series",
"intervalFactor": 1,
"range": true,
"refId": "A"
}
],
"title": "有效缓存大小",
"type": "stat"
},
{
"datasource": "${DS_PROMETHEUS}",
"description": "数据库的维护操作包括VACUUM、CREATE INDEX和ALTER TABLE ADD FOREIGN KEY等操作。\n\n值如果比较大,通常可以缩短VACUUM数据库和从dump文件中恢复数据库需要的时间。\n\nmaintenance_work_mem存放在每个数据库进程的私有内存中,而不是存放在数据库的共享内存中。这个参数可以在任何时候被设置",
"fieldConfig": {
"defaults": {
"color": {
"mode": "thresholds"
},
"mappings": [
{
"options": {
"match": "null",
"result": {
"text": "N/A"
}
},
"type": "special"
}
],
"thresholds": {
"mode": "absolute",
"steps": [
{
"color": "green",
"value": null
},
{
"color": "red",
"value": 80
}
]
},
"unit": "bytes"
},
"overrides": []
},
"gridPos": {
"h": 3,
"w": 3,
"x": 6,
"y": 3
},
"id": 44,
"links": [],
"maxDataPoints": 100,
"options": {
"colorMode": "none",
"graphMode": "none",
"justifyMode": "auto",
"orientation": "horizontal",
"reduceOptions": {
"calcs": [
"lastNotNull"
],
"fields": "",
"values": false
},
"textMode": "auto"
},
"pluginVersion": "9.2.1",
"targets": [
{
"datasource": "${DS_PROMETHEUS}",
"editorMode": "code",
"expr": "pg_settings_maintenance_work_mem_bytes{instance=\"$instance\"}",
"format": "time_series",
"intervalFactor": 1,
"range": true,
"refId": "A"
}
],
"title": "维护工作内存",
"type": "stat"
},
{
"datasource": "${DS_PROMETHEUS}",
"description": "声明内部排序操作和Hash表在开始使用临时磁盘文件之前使用的内存数目",
"fieldConfig": {
"defaults": {
"color": {
"mode": "thresholds"
},
"mappings": [
{
"options": {
"match": "null",
"result": {
"text": "N/A"
}
},
"type": "special"
}
],
"thresholds": {
"mode": "absolute",
"steps": [
{
"color": "green",
"value": null
},
{
"color": "red",
"value": 80
}
]
},
"unit": "bytes"
},
"overrides": []
},
"gridPos": {
"h": 3,
"w": 3,
"x": 9,
"y": 3
},
"id": 46,
"links": [],
"maxDataPoints": 100,
"options": {
"colorMode": "none",
"graphMode": "none",
"justifyMode": "auto",
"orientation": "horizontal",
"reduceOptions": {
"calcs": [
"lastNotNull"
],
"fields": "",
"values": false
},
"textMode": "auto"
},
"pluginVersion": "9.2.1",
"targets": [
{
"datasource": "${DS_PROMETHEUS}",
"editorMode": "code",
"expr": "pg_settings_work_mem_bytes{instance=\"$instance\"}",
"format": "time_series",
"intervalFactor": 1,
"legendFormat": "",
"range": true,
"refId": "A"
}
],
"title": "工作内存",
"type": "stat"
},
{
"datasource": "${DS_PROMETHEUS}",
"fieldConfig": {
"defaults": {
"color": {
"mode": "thresholds"
},
"decimals": 1,
"mappings": [
{
"options": {
"match": "null",
"result": {
"text": "N/A"
}
},
"type": "special"
}
],
"thresholds": {
"mode": "absolute",
"steps": [
{
"color": "green",
"value": null
},
{
"color": "red",
"value": 80
}
]
},
"unit": "bytes"
},
"overrides": []
},
"gridPos": {
"h": 3,
"w": 3,
"x": 12,
"y": 3
},
"id": 48,
"links": [],
"maxDataPoints": 100,
"options": {
"colorMode": "none",
"graphMode": "none",
"justifyMode": "auto",
"orientation": "horizontal",
"reduceOptions": {
"calcs": [
"lastNotNull"
],
"fields": "",
"values": false
},
"textMode": "auto"
},
"pluginVersion": "9.2.1",
"targets": [
{
"datasource": "${DS_PROMETHEUS}",
"expr": "pg_settings_max_wal_size_bytes{instance=\"$instance\"}",
"format": "time_series",
"intervalFactor": 1,
"refId": "A"
}
],
"title": "单个最大WAL文件大小",
"type": "stat"
},
{
"datasource": "${DS_PROMETHEUS}",
"description": "如果系统Cache使用状况良好,那么,random_page_cost可以适当降低",
"fieldConfig": {
"defaults": {
"color": {
"mode": "thresholds"
},
"mappings": [
{
"options": {
"match": "null",
"result": {
"text": "N/A"
}
},
"type": "special"
}
],
"thresholds": {
"mode": "absolute",
"steps": [
{
"color": "green",
"value": null
},
{
"color": "red",
"value": 80
}
]
},
"unit": "none"
},
"overrides": []
},
"gridPos": {
"h": 3,
"w": 3,
"x": 15,
"y": 3
},
"id": 50,
"links": [],
"maxDataPoints": 100,
"options": {
"colorMode": "none",
"graphMode": "none",
"justifyMode": "auto",
"orientation": "horizontal",
"reduceOptions": {
"calcs": [
"lastNotNull"
],
"fields": "",
"values": false
},
"textMode": "auto"
},
"pluginVersion": "9.2.1",
"targets": [
{
"datasource": "${DS_PROMETHEUS}",
"editorMode": "code",
"expr": "pg_settings_random_page_cost{instance=\"$instance\"}",
"format": "time_series",
"intervalFactor": 1,
"range": true,
"refId": "A"
}
],
"title": "随机扫描页面成本",
"type": "stat"
},
{
"datasource": "${DS_PROMETHEUS}",
"fieldConfig": {
"defaults": {
"color": {
"mode": "thresholds"
},
"mappings": [
{
"options": {
"match": "null",
"result": {
"text": "N/A"
}
},
"type": "special"
}
],
"thresholds": {
"mode": "absolute",
"steps": [
{
"color": "green",
"value": null
},
{
"color": "red",
"value": 80
}
]
},
"unit": "none"
},
"overrides": []
},
"gridPos": {
"h": 3,
"w": 2,
"x": 18,
"y": 3
},
"id": 52,
"links": [],
"maxDataPoints": 100,
"options": {
"colorMode": "none",
"graphMode": "none",
"justifyMode": "auto",
"orientation": "horizontal",
"reduceOptions": {
"calcs": [
"lastNotNull"
],
"fields": "",
"values": false
},
"textMode": "auto"
},
"pluginVersion": "9.2.1",
"targets": [
{
"datasource": "${DS_PROMETHEUS}",
"editorMode": "code",
"expr": "pg_settings_seq_page_cost",
"format": "time_series",
"intervalFactor": 1,
"range": true,
"refId": "A"
}
],
"title": "顺序扫描页面成本",
"type": "stat"
},
{
"datasource": "${DS_PROMETHEUS}",
"fieldConfig": {
"defaults": {
"color": {
"mode": "thresholds"
},
"mappings": [
{
"options": {
"match": "null",
"result": {
"text": "N/A"
}
},
"type": "special"
}
],
"thresholds": {
"mode": "absolute",
"steps": [
{
"color": "green",
"value": null
},
{
"color": "red",
"value": 80
}
]
},
"unit": "none"
},
"overrides": []
},
"gridPos": {
"h": 3,
"w": 2,
"x": 20,
"y": 3
},
"id": 54,
"links": [],
"maxDataPoints": 100,
"options": {
"colorMode": "none",
"graphMode": "none",
"justifyMode": "auto",
"orientation": "horizontal",
"reduceOptions": {
"calcs": [
"mean"
],
"fields": "",
"values": false
},
"textMode": "auto"
},
"pluginVersion": "9.2.1",
"targets": [
{
"datasource": "${DS_PROMETHEUS}",
"expr": "pg_settings_max_worker_processes{instance=\"$instance\"}",
"format": "time_series",
"intervalFactor": 1,
"refId": "A"
}
],
"title": "最大进程数",
"type": "stat"
},
{
"datasource": "${DS_PROMETHEUS}",
"fieldConfig": {
"defaults": {
"color": {
"mode": "thresholds"
},
"mappings": [
{
"options": {
"match": "null",
"result": {
"text": "N/A"
}
},
"type": "special"
}
],
"thresholds": {
"mode": "absolute",
"steps": [
{
"color": "green",
"value": null
},
{
"color": "red",
"value": 80
}
]
},
"unit": "none"
},
"overrides": []
},
"gridPos": {
"h": 3,
"w": 2,
"x": 22,
"y": 3
},
"id": 56,
"links": [],
"maxDataPoints": 100,
"options": {
"colorMode": "none",
"graphMode": "none",
"justifyMode": "auto",
"orientation": "horizontal",
"reduceOptions": {
"calcs": [
"lastNotNull"
],
"fields": "",
"values": false
},
"textMode": "auto"
},
"pluginVersion": "9.2.1",
"targets": [
{
"datasource": "${DS_PROMETHEUS}",
"editorMode": "code",
"expr": "pg_settings_max_parallel_workers{instance=\"$instance\"}",
"format": "time_series",
"intervalFactor": 1,
"range": true,
"refId": "A"
}
],
"title": "最大并行工作数",
"type": "stat"
},
{
"datasource": "${DS_PROMETHEUS}",
"fieldConfig": {
"defaults": {
"color": {
"mode": "thresholds"
},
"mappings": [
{
"options": {
"match": "null",
"result": {
"text": "N/A"
}
},
"type": "special"
}
],
"thresholds": {
"mode": "absolute",
"steps": [
{
"color": "green",
"value": null
},
{
"color": "red",
"value": 80
}
]
},
"unit": "s"
},
"overrides": []
},
"gridPos": {
"h": 3,
"w": 3,
"x": 0,
"y": 6
},
"id": 107,
"links": [],
"maxDataPoints": 100,
"options": {
"colorMode": "none",
"graphMode": "none",
"justifyMode": "auto",
"orientation": "horizontal",
"reduceOptions": {
"calcs": [
"lastNotNull"
],
"fields": "",
"values": false
},
"textMode": "auto"
},
"pluginVersion": "9.2.1",
"targets": [
{
"datasource": "${DS_PROMETHEUS}",
"editorMode": "code",
"expr": "pg_settings_authentication_timeout_seconds{instance=\"$instance\"}",
"format": "time_series",
"intervalFactor": 1,
"range": true,
"refId": "A"
}
],
"title": "认证超时时间",
"type": "stat"
},
{
"datasource": "${DS_PROMETHEUS}",
"description": "",
"fieldConfig": {
"defaults": {
"color": {
"mode": "thresholds"
},
"mappings": [
{
"options": {
"match": "null",
"result": {
"text": "N/A"
}
},
"type": "special"
}
],
"thresholds": {
"mode": "absolute",
"steps": [
{
"color": "green",
"value": null
},
{
"color": "red",
"value": 80
}
]
},
"unit": "ms"
},
"overrides": []
},
"gridPos": {
"h": 3,
"w": 3,
"x": 3,
"y": 6
},
"id": 121,
"links": [],
"maxDataPoints": 100,
"options": {
"colorMode": "none",
"graphMode": "none",
"justifyMode": "auto",
"orientation": "horizontal",
"reduceOptions": {
"calcs": [
"lastNotNull"
],
"fields": "",
"values": false
},
"textMode": "auto"
},
"pluginVersion": "9.2.1",
"targets": [
{
"datasource": "${DS_PROMETHEUS}",
"editorMode": "code",
"expr": "pg_settings_statement_timeout_seconds{instance=\"$instance\"}",
"format": "time_series",
"intervalFactor": 1,
"range": true,
"refId": "A"
}
],
"title": "SQL执行超时时间",
"type": "stat"
},
{
"datasource": "${DS_PROMETHEUS}",
"description": "",
"fieldConfig": {
"defaults": {
"color": {
"mode": "thresholds"
},
"mappings": [
{
"options": {
"match": "null",
"result": {
"text": "N/A"
}
},
"type": "special"
}
],
"thresholds": {
"mode": "absolute",
"steps": [
{
"color": "green",
"value": null
},
{
"color": "red",
"value": 80
}
]
},
"unit": "s"
},
"overrides": []
},
"gridPos": {
"h": 3,
"w": 3,
"x": 6,
"y": 6
},
"id": 120,
"links": [],
"maxDataPoints": 100,
"options": {
"colorMode": "none",
"graphMode": "none",
"justifyMode": "auto",
"orientation": "horizontal",
"reduceOptions": {
"calcs": [
"lastNotNull"
],
"fields": "",
"values": false
},
"textMode": "auto"
},
"pluginVersion": "9.2.1",
"targets": [
{
"datasource": "${DS_PROMETHEUS}",
"editorMode": "code",
"expr": "pg_settings_lock_timeout_seconds{instance=\"$instance\"}",
"format": "time_series",
"intervalFactor": 1,
"range": true,
"refId": "A"
}
],
"title": "等待锁超时时间",
"type": "stat"
},
{
"datasource": "${DS_PROMETHEUS}",
"description": "默认为0,禁用连接检查",
"fieldConfig": {
"defaults": {
"color": {
"mode": "thresholds"
},
"mappings": [
{
"options": {
"match": "null",
"result": {
"text": "N/A"
}
},
"type": "special"
}
],
"thresholds": {
"mode": "absolute",
"steps": [
{
"color": "green",
"value": null
},
{
"color": "red",
"value": 80
}
]
},
"unit": "s"
},
"overrides": []
},
"gridPos": {
"h": 3,
"w": 3,
"x": 9,
"y": 6
},
"id": 110,
"links": [],
"maxDataPoints": 100,
"options": {
"colorMode": "none",
"graphMode": "none",
"justifyMode": "auto",
"orientation": "horizontal",
"reduceOptions": {
"calcs": [
"lastNotNull"
],
"fields": "",
"values": false
},
"textMode": "auto"
},
"pluginVersion": "9.2.1",
"targets": [
{
"datasource": "${DS_PROMETHEUS}",
"editorMode": "code",
"expr": "pg_settings_client_connection_check_interval_seconds{instance=\"$instance\"}",
"format": "time_series",
"intervalFactor": 1,
"range": true,
"refId": "A"
}
],
"title": "客户端断开连接的时间间隔",
"type": "stat"
},
{
"datasource": "${DS_PROMETHEUS}",
"fieldConfig": {
"defaults": {
"color": {
"mode": "thresholds"
},
"mappings": [
{
"options": {
"match": "null",
"result": {
"text": "N/A"
}
},
"type": "special"
}
],
"thresholds": {
"mode": "absolute",
"steps": [
{
"color": "green",
"value": null
},
{
"color": "red",
"value": 80
}
]
},
"unit": "s"
},
"overrides": []
},
"gridPos": {
"h": 3,
"w": 3,
"x": 12,
"y": 6
},
"id": 112,
"links": [],
"maxDataPoints": 100,
"options": {
"colorMode": "none",
"graphMode": "none",
"justifyMode": "auto",
"orientation": "horizontal",
"reduceOptions": {
"calcs": [
"lastNotNull"
],
"fields": "",
"values": false
},
"textMode": "auto"
},
"pluginVersion": "9.2.1",
"targets": [
{
"datasource": "${DS_PROMETHEUS}",
"editorMode": "code",
"expr": "pg_settings_deadlock_timeout_seconds{instance=\"$instance\"}",
"format": "time_series",
"intervalFactor": 1,
"range": true,
"refId": "A"
}
],
"title": "检查死锁之前等待锁的时间",
"type": "stat"
},
{
"datasource": "${DS_PROMETHEUS}",
"description": "",
"fieldConfig": {
"defaults": {
"color": {
"mode": "thresholds"
},
"mappings": [
{
"options": {
"match": "null",
"result": {
"text": "N/A"
}
},
"type": "special"
}
],
"thresholds": {
"mode": "absolute",
"steps": [
{
"color": "green",
"value": null
},
{
"color": "red",
"value": 80
}
]
},
"unit": "s"
},
"overrides": []
},
"gridPos": {
"h": 3,
"w": 3,
"x": 15,
"y": 6
},
"id": 122,
"links": [],
"maxDataPoints": 100,
"options": {
"colorMode": "none",
"graphMode": "none",
"justifyMode": "auto",
"orientation": "horizontal",
"reduceOptions": {
"calcs": [
"lastNotNull"
],
"fields": "",
"values": false
},
"textMode": "auto"
},
"pluginVersion": "9.2.1",
"targets": [
{
"datasource": "${DS_PROMETHEUS}",
"editorMode": "code",
"expr": "pg_settings_tcp_user_timeout_seconds{instance=\"$instance\"}",
"format": "time_series",
"intervalFactor": 1,
"range": true,
"refId": "A"
}
],
"title": "TCP用户超时时间",
"type": "stat"
},
{
"datasource": "${DS_PROMETHEUS}",
"description": "",
"fieldConfig": {
"defaults": {
"color": {
"mode": "thresholds"
},
"mappings": [
{
"options": {
"match": "null",
"result": {
"text": "N/A"
}
},
"type": "special"
}
],
"thresholds": {
"mode": "absolute",
"steps": [
{
"color": "green",
"value": null
},
{
"color": "red",
"value": 80
}
]
},
"unit": "s"
},
"overrides": []
},
"gridPos": {
"h": 3,
"w": 3,
"x": 18,
"y": 6
},
"id": 119,
"links": [],
"maxDataPoints": 100,
"options": {
"colorMode": "none",
"graphMode": "none",
"justifyMode": "auto",
"orientation": "horizontal",
"reduceOptions": {
"calcs": [
"lastNotNull"
],
"fields": "",
"values": false
},
"textMode": "auto"
},
"pluginVersion": "9.2.1",
"targets": [
{
"datasource": "${DS_PROMETHEUS}",
"editorMode": "code",
"expr": "pg_settings_idle_session_timeout_seconds{instance=\"$instance\"}",
"format": "time_series",
"intervalFactor": 1,
"range": true,
"refId": "A"
}
],
"title": "空闲会话超时时间",
"type": "stat"
},
{
"datasource": "${DS_PROMETHEUS}",
"fieldConfig": {
"defaults": {
"color": {
"mode": "thresholds"
},
"mappings": [
{
"options": {
"match": "null",
"result": {
"text": "N/A"
}
},
"type": "special"
}
],
"thresholds": {
"mode": "absolute",
"steps": [
{
"color": "green",
"value": null
},
{
"color": "red",
"value": 80
}
]
},
"unit": "s"
},
"overrides": []
},
"gridPos": {
"h": 3,
"w": 3,
"x": 21,
"y": 6
},
"id": 105,
"links": [],
"maxDataPoints": 100,
"options": {
"colorMode": "none",
"graphMode": "none",
"justifyMode": "auto",
"orientation": "horizontal",
"reduceOptions": {
"calcs": [
"lastNotNull"
],
"fields": "",
"values": false
},
"textMode": "auto"
},
"pluginVersion": "9.2.1",
"targets": [
{
"datasource": "${DS_PROMETHEUS}",
"editorMode": "code",
"expr": "pg_settings_archive_timeout_seconds{instance=\"$instance\"}",
"format": "time_series",
"intervalFactor": 1,
"range": true,
"refId": "A"
}
],
"title": "WAL归档周期时间",
"type": "stat"
},
{
"datasource": "${DS_PROMETHEUS}",
"description": "一个TCP连接当中空闲多长时间后会发送一个keepalive报文,默认为0,表示使用操作系统设置的默认值",
"fieldConfig": {
"defaults": {
"color": {
"mode": "thresholds"
},
"mappings": [
{
"options": {
"match": "null",
"result": {
"text": "N/A"
}
},
"type": "special"
}
],
"thresholds": {
"mode": "absolute",
"steps": [
{
"color": "green",
"value": null
},
{
"color": "red",
"value": 80
}
]
},
"unit": "s"
},
"overrides": []
},
"gridPos": {
"h": 3,
"w": 3,
"x": 0,
"y": 9
},
"id": 117,
"links": [],
"maxDataPoints": 100,
"options": {
"colorMode": "none",
"graphMode": "none",
"justifyMode": "auto",
"orientation": "horizontal",
"reduceOptions": {
"calcs": [
"lastNotNull"
],
"fields": "",
"values": false
},
"textMode": "auto"
},
"pluginVersion": "9.2.1",
"targets": [
{
"datasource": "${DS_PROMETHEUS}",
"editorMode": "code",
"expr": "pg_settings_tcp_keepalives_idle_seconds{instance=\"$instance\"}",
"format": "time_series",
"intervalFactor": 1,
"range": true,
"refId": "A"
}
],
"title": "TCP保持连接空间时间",
"type": "stat"
},
{
"datasource": "${DS_PROMETHEUS}",
"description": "如果一个连接发送keepalive没收到回应,最多重试N次释放连接",
"fieldConfig": {
"defaults": {
"color": {
"mode": "thresholds"
},
"mappings": [
{
"options": {
"match": "null",
"result": {
"text": "N/A"
}
},
"type": "special"
}
],
"thresholds": {
"mode": "absolute",
"steps": [
{
"color": "green",
"value": null
},
{
"color": "red",
"value": 80
}
]
},
"unit": "none"
},
"overrides": []
},
"gridPos": {
"h": 3,
"w": 3,
"x": 3,
"y": 9
},
"id": 115,
"links": [],
"maxDataPoints": 100,
"options": {
"colorMode": "none",
"graphMode": "none",
"justifyMode": "auto",
"orientation": "horizontal",
"reduceOptions": {
"calcs": [
"lastNotNull"
],
"fields": "",
"values": false
},
"textMode": "auto"
},
"pluginVersion": "9.2.1",
"targets": [
{
"datasource": "${DS_PROMETHEUS}",
"editorMode": "code",
"expr": "pg_settings_tcp_keepalives_count{instance=\"$instance\"}",
"format": "time_series",
"intervalFactor": 1,
"range": true,
"refId": "A"
}
],
"title": "TCP保持连接重试次数",
"type": "stat"
},
{
"datasource": "${DS_PROMETHEUS}",
"description": "连接失败后的重试间隔",
"fieldConfig": {
"defaults": {
"color": {
"mode": "thresholds"
},
"mappings": [
{
"options": {
"match": "null",
"result": {
"text": "N/A"
}
},
"type": "special"
}
],
"thresholds": {
"mode": "absolute",
"steps": [
{
"color": "green",
"value": null
},
{
"color": "red",
"value": 80
}
]
},
"unit": "s"
},
"overrides": []
},
"gridPos": {
"h": 3,
"w": 3,
"x": 6,
"y": 9
},
"id": 116,
"links": [],
"maxDataPoints": 100,
"options": {
"colorMode": "none",
"graphMode": "none",
"justifyMode": "auto",
"orientation": "horizontal",
"reduceOptions": {
"calcs": [
"lastNotNull"
],
"fields": "",
"values": false
},
"textMode": "auto"
},
"pluginVersion": "9.2.1",
"targets": [
{
"datasource": "${DS_PROMETHEUS}",
"editorMode": "code",
"expr": "pg_settings_tcp_keepalives_interval_seconds{instance=\"$instance\"}",
"format": "time_series",
"intervalFactor": 1,
"range": true,
"refId": "A"
}
],
"title": "TCP保持连接重试间隔",
"type": "stat"
},
{
"datasource": "${DS_PROMETHEUS}",
"description": "",
"fieldConfig": {
"defaults": {
"color": {
"mode": "thresholds"
},
"mappings": [
{
"options": {
"match": "null",
"result": {
"text": "N/A"
}
},
"type": "special"
}
],
"thresholds": {
"mode": "absolute",
"steps": [
{
"color": "green",
"value": null
},
{
"color": "red",
"value": 80
}
]
},
"unit": "bytes"
},
"overrides": []
},
"gridPos": {
"h": 3,
"w": 3,
"x": 9,
"y": 9
},
"id": 118,
"links": [],
"maxDataPoints": 100,
"options": {
"colorMode": "none",
"graphMode": "none",
"justifyMode": "auto",
"orientation": "horizontal",
"reduceOptions": {
"calcs": [
"lastNotNull"
],
"fields": "",
"values": false
},
"textMode": "auto"
},
"pluginVersion": "9.2.1",
"targets": [
{
"datasource": "${DS_PROMETHEUS}",
"editorMode": "code",
"expr": "pg_settings_temp_file_limit_bytes{instance=\"$instance\"}",
"format": "time_series",
"intervalFactor": 1,
"legendFormat": "",
"range": true,
"refId": "A"
}
],
"title": "临时文件大小限制",
"type": "stat"
},
{
"datasource": "${DS_PROMETHEUS}",
"description": "",
"fieldConfig": {
"defaults": {
"color": {
"mode": "thresholds"
},
"mappings": [
{
"options": {
"match": "null",
"result": {
"text": "N/A"
}
},
"type": "special"
}
],
"thresholds": {
"mode": "absolute",
"steps": [
{
"color": "green",
"value": null
},
{
"color": "red",
"value": 80
}
]
},
"unit": "s"
},
"overrides": []
},
"gridPos": {
"h": 3,
"w": 3,
"x": 12,
"y": 9
},
"id": 123,
"links": [],
"maxDataPoints": 100,
"options": {
"colorMode": "none",
"graphMode": "none",
"justifyMode": "auto",
"orientation": "horizontal",
"reduceOptions": {
"calcs": [
"lastNotNull"
],
"fields": "",
"values": false
},
"textMode": "auto"
},
"pluginVersion": "9.2.1",
"targets": [
{
"datasource": "${DS_PROMETHEUS}",
"editorMode": "code",
"expr": "pg_settings_wal_receiver_timeout_seconds{instance=\"$instance\"}",
"format": "time_series",
"intervalFactor": 1,
"range": true,
"refId": "A"
}
],
"title": "接收wal超时时间",
"type": "stat"
},
{
"datasource": "${DS_PROMETHEUS}",
"description": "",
"fieldConfig": {
"defaults": {
"color": {
"mode": "thresholds"
},
"mappings": [
{
"options": {
"match": "null",
"result": {
"text": "N/A"
}
},
"type": "special"
}
],
"thresholds": {
"mode": "absolute",
"steps": [
{
"color": "green",
"value": null
},
{
"color": "red",
"value": 80
}
]
},
"unit": "s"
},
"overrides": []
},
"gridPos": {
"h": 3,
"w": 3,
"x": 15,
"y": 9
},
"id": 124,
"links": [],
"maxDataPoints": 100,
"options": {
"colorMode": "none",
"graphMode": "none",
"justifyMode": "auto",
"orientation": "horizontal",
"reduceOptions": {
"calcs": [
"lastNotNull"
],
"fields": "",
"values": false
},
"textMode": "auto"
},
"pluginVersion": "9.2.1",
"targets": [
{
"datasource": "${DS_PROMETHEUS}",
"editorMode": "code",
"expr": "pg_settings_wal_sender_timeout_seconds{instance=\"$instance\"}",
"format": "time_series",
"intervalFactor": 1,
"range": true,
"refId": "A"
}
],
"title": "发送wal超时时间",
"type": "stat"
},
{
"datasource": "${DS_PROMETHEUS}",
"fieldConfig": {
"defaults": {
"color": {
"mode": "thresholds"
},
"mappings": [
{
"options": {
"match": "null",
"result": {
"text": "N/A"
}
},
"type": "special"
}
],
"thresholds": {
"mode": "absolute",
"steps": [
{
"color": "green",
"value": null
},
{
"color": "red",
"value": 80
}
]
},
"unit": "none"
},
"overrides": []
},
"gridPos": {
"h": 3,
"w": 3,
"x": 18,
"y": 9
},
"id": 114,
"links": [],
"maxDataPoints": 100,
"options": {
"colorMode": "none",
"graphMode": "none",
"justifyMode": "auto",
"orientation": "horizontal",
"reduceOptions": {
"calcs": [
"lastNotNull"
],
"fields": "",
"values": false
},
"textMode": "auto"
},
"pluginVersion": "9.2.1",
"targets": [
{
"datasource": "${DS_PROMETHEUS}",
"editorMode": "code",
"expr": "pg_settings_max_replication_slots{instance=\"$instance\"}",
"format": "time_series",
"intervalFactor": 1,
"range": true,
"refId": "A"
}
],
"title": "允许最大复制槽",
"type": "stat"
},
{
"datasource": "${DS_PROMETHEUS}",
"description": "",
"fieldConfig": {
"defaults": {
"color": {
"mode": "thresholds"
},
"mappings": [
{
"options": {
"match": "null",
"result": {
"text": "N/A"
}
},
"type": "special"
}
],
"thresholds": {
"mode": "absolute",
"steps": [
{
"color": "green",
"value": null
},
{
"color": "red",
"value": 80
}
]
},
"unit": "bytes"
},
"overrides": []
},
"gridPos": {
"h": 3,
"w": 3,
"x": 21,
"y": 9
},
"id": 109,
"links": [],
"maxDataPoints": 100,
"options": {
"colorMode": "none",
"graphMode": "none",
"justifyMode": "auto",
"orientation": "horizontal",
"reduceOptions": {
"calcs": [
"lastNotNull"
],
"fields": "",
"values": false
},
"textMode": "auto"
},
"pluginVersion": "9.2.1",
"targets": [
{
"datasource": "${DS_PROMETHEUS}",
"editorMode": "code",
"expr": "pg_settings_block_size{instance=\"$instance\"}",
"format": "time_series",
"intervalFactor": 1,
"legendFormat": "",
"range": true,
"refId": "A"
}
],
"title": "磁盘块大小",
"type": "stat"
},
{
"datasource": "${DS_PROMETHEUS}",
"fieldConfig": {
"defaults": {
"color": {
"mode": "thresholds"
},
"mappings": [
{
"options": {
"match": "null",
"result": {
"text": "N/A"
}
},
"type": "special"
}
],
"thresholds": {
"mode": "absolute",
"steps": [
{
"color": "green",
"value": null
},
{
"color": "red",
"value": 80
}
]
},
"unit": "bool"
},
"overrides": []
},
"gridPos": {
"h": 3,
"w": 3,
"x": 0,
"y": 12
},
"id": 108,
"links": [],
"maxDataPoints": 100,
"options": {
"colorMode": "none",
"graphMode": "none",
"justifyMode": "auto",
"orientation": "horizontal",
"reduceOptions": {
"calcs": [
"lastNotNull"
],
"fields": "",
"values": false
},
"textMode": "auto"
},
"pluginVersion": "9.2.1",
"targets": [
{
"datasource": "${DS_PROMETHEUS}",
"editorMode": "code",
"expr": "pg_settings_autovacuum{instance=\"$instance\"}",
"format": "time_series",
"intervalFactor": 1,
"range": true,
"refId": "A"
}
],
"title": "是否开启自动清理",
"type": "stat"
},
{
"datasource": "${DS_PROMETHEUS}",
"fieldConfig": {
"defaults": {
"color": {
"mode": "thresholds"
},
"mappings": [
{
"options": {
"match": "null",
"result": {
"text": "N/A"
}
},
"type": "special"
}
],
"thresholds": {
"mode": "absolute",
"steps": [
{
"color": "green",
"value": null
},
{
"color": "red",
"value": 80
}
]
},
"unit": "bool"
},
"overrides": []
},
"gridPos": {
"h": 3,
"w": 3,
"x": 3,
"y": 12
},
"id": 111,
"links": [],
"maxDataPoints": 100,
"options": {
"colorMode": "none",
"graphMode": "none",
"justifyMode": "auto",
"orientation": "horizontal",
"reduceOptions": {
"calcs": [
"lastNotNull"
],
"fields": "",
"values": false
},
"textMode": "auto"
},
"pluginVersion": "9.2.1",
"targets": [
{
"datasource": "${DS_PROMETHEUS}",
"editorMode": "code",
"expr": "pg_settings_data_checksums{instance=\"$instance\"}",
"format": "time_series",
"intervalFactor": 1,
"range": true,
"refId": "A"
}
],
"title": "是否开启数据校验",
"type": "stat"
},
{
"datasource": "${DS_PROMETHEUS}",
"fieldConfig": {
"defaults": {
"color": {
"mode": "thresholds"
},
"mappings": [
{
"options": {
"match": "null",
"result": {
"text": "N/A"
}
},
"type": "special"
}
],
"thresholds": {
"mode": "absolute",
"steps": [
{
"color": "green",
"value": null
},
{
"color": "red",
"value": 80
}
]
},
"unit": "bool"
},
"overrides": []
},
"gridPos": {
"h": 3,
"w": 3,
"x": 6,
"y": 12
},
"id": 113,
"links": [],
"maxDataPoints": 100,
"options": {
"colorMode": "none",
"graphMode": "none",
"justifyMode": "auto",
"orientation": "horizontal",
"reduceOptions": {
"calcs": [
"lastNotNull"
],
"fields": "",
"values": false
},
"textMode": "auto"
},
"pluginVersion": "9.2.1",
"targets": [
{
"datasource": "${DS_PROMETHEUS}",
"editorMode": "code",
"expr": "pg_settings_debug_assertions{instance=\"$instance\"}",
"format": "time_series",
"intervalFactor": 1,
"range": true,
"refId": "A"
}
],
"title": "是否开启debug",
"type": "stat"
},
{
"datasource": "${DS_PROMETHEUS}",
"fieldConfig": {
"defaults": {
"color": {
"mode": "thresholds"
},
"mappings": [
{
"options": {
"match": "null",
"result": {
"text": "N/A"
}
},
"type": "special"
}
],
"thresholds": {
"mode": "absolute",
"steps": [
{
"color": "green",
"value": null
},
{
"color": "red",
"value": 80
}
]
},
"unit": "bool"
},
"overrides": []
},
"gridPos": {
"h": 3,
"w": 3,
"x": 9,
"y": 12
},
"id": 106,
"links": [],
"maxDataPoints": 100,
"options": {
"colorMode": "none",
"graphMode": "none",
"justifyMode": "auto",
"orientation": "horizontal",
"reduceOptions": {
"calcs": [
"lastNotNull"
],
"fields": "",
"values": false
},
"textMode": "auto"
},
"pluginVersion": "9.2.1",
"targets": [
{
"datasource": "${DS_PROMETHEUS}",
"editorMode": "code",
"expr": "pg_settings_array_nulls{instance=\"$instance\"}",
"format": "time_series",
"intervalFactor": 1,
"range": true,
"refId": "A"
}
],
"title": "是否允许数组中包含空值",
"type": "stat"
}
],
"targets": [
{
"datasource": "${DS_PROMETHEUS}",
"refId": "A"
}
],
"title": "配置信息",
"type": "row"
},
{
"collapsed": true,
"datasource": "${DS_PROMETHEUS}",
"gridPos": {
"h": 1,
"w": 24,
"x": 0,
"y": 3
},
"id": 30,
"panels": [
{
"datasource": "${DS_PROMETHEUS}",
"fieldConfig": {
"defaults": {
"color": {
"mode": "palette-classic"
},
"custom": {
"axisCenteredZero": false,
"axisColorMode": "text",
"axisLabel": "",
"axisPlacement": "auto",
"barAlignment": 0,
"drawStyle": "points",
"fillOpacity": 10,
"gradientMode": "none",
"hideFrom": {
"legend": false,
"tooltip": false,
"viz": false
},
"lineInterpolation": "linear",
"lineWidth": 1,
"pointSize": 8,
"scaleDistribution": {
"type": "linear"
},
"showPoints": "always",
"spanNulls": true,
"stacking": {
"group": "A",
"mode": "none"
},
"thresholdsStyle": {
"mode": "off"
}
},
"decimals": 0,
"links": [],
"mappings": [],
"thresholds": {
"mode": "absolute",
"steps": [
{
"color": "green",
"value": null
},
{
"color": "red",
"value": 80
}
]
},
"unit": "none"
},
"overrides": []
},
"gridPos": {
"h": 11,
"w": 13,
"x": 0,
"y": 9
},
"id": 1,
"links": [],
"options": {
"legend": {
"calcs": [
"mean",
"lastNotNull",
"max"
],
"displayMode": "table",
"placement": "bottom",
"showLegend": true
},
"tooltip": {
"mode": "multi",
"sort": "none"
}
},
"pluginVersion": "9.2.1",
"targets": [
{
"datasource": "${DS_PROMETHEUS}",
"editorMode": "code",
"expr": "pg_stat_activity_count{datname=~\"$datname\", instance=~\"$instance\", state=\"active\"} !=0",
"format": "time_series",
"interval": "",
"intervalFactor": 2,
"legendFormat": "{{datname}}, s: {{state}}",
"range": true,
"refId": "A",
"step": 2
}
],
"title": "活动连接数",
"type": "timeseries"
},
{
"aliasColors": {},
"bars": false,
"dashLength": 10,
"dashes": false,
"datasource": "${DS_PROMETHEUS}",
"fieldConfig": {
"defaults": {
"links": []
},
"overrides": []
},
"fill": 1,
"fillGradient": 0,
"gridPos": {
"h": 11,
"w": 11,
"x": 13,
"y": 9
},
"hiddenSeries": false,
"id": 4,
"legend": {
"alignAsTable": true,
"avg": false,
"current": true,
"max": true,
"min": false,
"rightSide": false,
"show": true,
"sort": "current",
"sortDesc": false,
"total": false,
"values": true
},
"lines": true,
"linewidth": 1,
"links": [],
"nullPointMode": "null",
"options": {
"alertThreshold": true
},
"percentage": false,
"pluginVersion": "9.2.1",
"pointradius": 5,
"points": false,
"renderer": "flot",
"seriesOverrides": [],
"spaceLength": 10,
"stack": false,
"steppedLine": false,
"targets": [
{
"datasource": "${DS_PROMETHEUS}",
"expr": "pg_stat_activity_count{datname=~\"$datname\", instance=~\"$instance\", state=~\"idle|idle in transaction|idle in transaction (aborted)\"}",
"format": "time_series",
"intervalFactor": 2,
"legendFormat": "{{datname}}, s: {{state}}",
"refId": "A",
"step": 2
}
],
"thresholds": [],
"timeRegions": [],
"title": "空闲会话",
"tooltip": {
"shared": true,
"sort": 0,
"value_type": "individual"
},
"type": "graph",
"xaxis": {
"mode": "time",
"show": true,
"values": []
},
"yaxes": [
{
"$$hashKey": "object:1393",
"format": "short",
"logBase": 1,
"min": "0",
"show": true
},
{
"$$hashKey": "object:1394",
"format": "short",
"logBase": 1,
"show": true
}
],
"yaxis": {
"align": false
}
},
{
"aliasColors": {},
"bars": false,
"dashLength": 10,
"dashes": false,
"datasource": "${DS_PROMETHEUS}",
"fieldConfig": {
"defaults": {
"links": []
},
"overrides": []
},
"fill": 1,
"fillGradient": 0,
"gridPos": {
"h": 12,
"w": 24,
"x": 0,
"y": 20
},
"hiddenSeries": false,
"id": 126,
"legend": {
"alignAsTable": true,
"avg": true,
"current": true,
"hideEmpty": true,
"hideZero": true,
"max": true,
"min": true,
"rightSide": false,
"show": true,
"sort": "current",
"sortDesc": true,
"total": false,
"values": true
},
"lines": true,
"linewidth": 1,
"links": [],
"nullPointMode": "null",
"options": {
"alertThreshold": true
},
"paceLength": 10,
"percentage": false,
"pluginVersion": "9.2.1",
"pointradius": 5,
"points": false,
"renderer": "flot",
"seriesOverrides": [],
"spaceLength": 10,
"stack": true,
"steppedLine": false,
"targets": [
{
"datasource": "${DS_PROMETHEUS}",
"editorMode": "code",
"expr": "topk(5, (pg_stat_activity_count{instance=\"$instance\"}))",
"format": "time_series",
"intervalFactor": 1,
"legendFormat": "{{datname}} {{state}}",
"range": true,
"refId": "A"
}
],
"thresholds": [],
"timeRegions": [],
"title": "连接详情",
"tooltip": {
"shared": true,
"sort": 2,
"value_type": "individual"
},
"type": "graph",
"xaxis": {
"mode": "time",
"show": true,
"values": []
},
"yaxes": [
{
"$$hashKey": "object:144",
"format": "short",
"logBase": 1,
"show": true
},
{
"$$hashKey": "object:145",
"format": "short",
"logBase": 1,
"show": true
}
],
"yaxis": {
"align": false
}
},
{
"aliasColors": {},
"bars": false,
"dashLength": 10,
"dashes": false,
"datasource": "${DS_PROMETHEUS}",
"fieldConfig": {
"defaults": {
"links": [],
"unit": "decbytes"
},
"overrides": []
},
"fill": 1,
"fillGradient": 0,
"gridPos": {
"h": 11,
"w": 24,
"x": 0,
"y": 32
},
"hiddenSeries": false,
"id": 128,
"legend": {
"avg": false,
"current": false,
"max": false,
"min": false,
"show": true,
"total": false,
"values": false
},
"lines": true,
"linewidth": 1,
"links": [],
"nullPointMode": "null",
"options": {
"alertThreshold": true
},
"percentage": false,
"pluginVersion": "9.2.1",
"pointradius": 5,
"points": false,
"renderer": "flot",
"seriesOverrides": [],
"spaceLength": 10,
"stack": false,
"steppedLine": false,
"targets": [
{
"datasource": "${DS_PROMETHEUS}",
"editorMode": "code",
"expr": "topk(5, (pg_database_size_bytes{instance=\"$instance\"}))",
"format": "time_series",
"intervalFactor": 2,
"legendFormat": "{{ datname }}",
"range": true,
"refId": "A"
}
],
"thresholds": [],
"timeRegions": [],
"title": "数据库大小",
"tooltip": {
"shared": true,
"sort": 0,
"value_type": "individual"
},
"type": "graph",
"xaxis": {
"mode": "time",
"show": true,
"values": []
},
"yaxes": [
{
"$$hashKey": "object:455",
"format": "decbytes",
"logBase": 1,
"show": true
},
{
"$$hashKey": "object:456",
"format": "short",
"logBase": 1,
"show": true
}
],
"yaxis": {
"align": false
}
},
{
"aliasColors": {},
"bars": false,
"dashLength": 10,
"dashes": false,
"datasource": "${DS_PROMETHEUS}",
"fieldConfig": {
"defaults": {
"links": []
},
"overrides": []
},
"fill": 1,
"fillGradient": 0,
"gridPos": {
"h": 11,
"w": 24,
"x": 0,
"y": 43
},
"hiddenSeries": false,
"id": 8,
"legend": {
"alignAsTable": true,
"avg": true,
"current": true,
"max": false,
"min": false,
"rightSide": false,
"show": true,
"sort": "current",
"sortDesc": true,
"total": true,
"values": true
},
"lines": true,
"linewidth": 1,
"links": [],
"nullPointMode": "null",
"options": {
"alertThreshold": true
},
"percentage": false,
"pluginVersion": "9.2.1",
"pointradius": 5,
"points": false,
"renderer": "flot",
"seriesOverrides": [],
"spaceLength": 10,
"stack": false,
"steppedLine": false,
"targets": [
{
"datasource": "${DS_PROMETHEUS}",
"editorMode": "code",
"expr": "pg_stat_database_tup_inserted{datname=~\"$datname\", instance=~\"$instance\"} != 0",
"format": "time_series",
"intervalFactor": 2,
"legendFormat": "{{datname}}",
"range": true,
"refId": "A",
"step": 2
}
],
"thresholds": [],
"timeRegions": [],
"title": "插入数据",
"tooltip": {
"shared": true,
"sort": 0,
"value_type": "individual"
},
"type": "graph",
"xaxis": {
"mode": "time",
"show": true,
"values": []
},
"yaxes": [
{
"$$hashKey": "object:627",
"format": "bytes",
"logBase": 1,
"show": true
},
{
"$$hashKey": "object:628",
"format": "short",
"logBase": 1,
"show": true
}
],
"yaxis": {
"align": false
}
},
{
"aliasColors": {},
"bars": false,
"dashLength": 10,
"dashes": false,
"datasource": "${DS_PROMETHEUS}",
"fieldConfig": {
"defaults": {
"links": []
},
"overrides": []
},
"fill": 1,
"fillGradient": 0,
"gridPos": {
"h": 11,
"w": 24,
"x": 0,
"y": 54
},
"hiddenSeries": false,
"id": 7,
"legend": {
"alignAsTable": true,
"avg": true,
"current": true,
"max": false,
"min": false,
"rightSide": false,
"show": true,
"sort": "current",
"sortDesc": true,
"total": true,
"values": true
},
"lines": true,
"linewidth": 1,
"links": [],
"nullPointMode": "null",
"options": {
"alertThreshold": true
},
"percentage": false,
"pluginVersion": "9.2.1",
"pointradius": 5,
"points": false,
"renderer": "flot",
"seriesOverrides": [],
"spaceLength": 10,
"stack": false,
"steppedLine": false,
"targets": [
{
"datasource": "${DS_PROMETHEUS}",
"expr": "pg_stat_database_tup_deleted{datname=~\"$datname\", instance=~\"$instance\"} != 0",
"format": "time_series",
"intervalFactor": 2,
"legendFormat": "{{datname}}",
"refId": "A",
"step": 2
}
],
"thresholds": [],
"timeRegions": [],
"title": "删除数据",
"tooltip": {
"shared": true,
"sort": 0,
"value_type": "individual"
},
"type": "graph",
"xaxis": {
"mode": "time",
"show": true,
"values": []
},
"yaxes": [
{
"$$hashKey": "object:714",
"format": "bytes",
"logBase": 1,
"show": true
},
{
"$$hashKey": "object:715",
"format": "short",
"logBase": 1,
"show": true
}
],
"yaxis": {
"align": false
}
},
{
"aliasColors": {},
"bars": false,
"dashLength": 10,
"dashes": false,
"datasource": "${DS_PROMETHEUS}",
"fieldConfig": {
"defaults": {
"links": []
},
"overrides": []
},
"fill": 1,
"fillGradient": 0,
"gridPos": {
"h": 11,
"w": 24,
"x": 0,
"y": 65
},
"hiddenSeries": false,
"id": 129,
"legend": {
"alignAsTable": true,
"avg": true,
"current": true,
"max": false,
"min": false,
"rightSide": false,
"show": true,
"sort": "current",
"sortDesc": true,
"total": true,
"values": true
},
"lines": true,
"linewidth": 1,
"links": [],
"nullPointMode": "null",
"options": {
"alertThreshold": true
},
"percentage": false,
"pluginVersion": "9.2.1",
"pointradius": 5,
"points": false,
"renderer": "flot",
"seriesOverrides": [],
"spaceLength": 10,
"stack": false,
"steppedLine": false,
"targets": [
{
"datasource": "${DS_PROMETHEUS}",
"expr": "pg_stat_database_tup_updated{datname=~\"$datname\", instance=~\"$instance\"} != 0",
"format": "time_series",
"intervalFactor": 2,
"legendFormat": "{{datname}}",
"refId": "A",
"step": 2
}
],
"thresholds": [],
"timeRegions": [],
"title": "修改数据",
"tooltip": {
"shared": true,
"sort": 0,
"value_type": "individual"
},
"type": "graph",
"xaxis": {
"mode": "time",
"show": true,
"values": []
},
"yaxes": [
{
"$$hashKey": "object:801",
"format": "bytes",
"logBase": 1,
"show": true
},
{
"$$hashKey": "object:802",
"format": "short",
"logBase": 1,
"show": true
}
],
"yaxis": {
"align": false
}
},
{
"aliasColors": {},
"bars": false,
"dashLength": 10,
"dashes": false,
"datasource": "${DS_PROMETHEUS}",
"fieldConfig": {
"defaults": {
"links": []
},
"overrides": []
},
"fill": 1,
"fillGradient": 0,
"gridPos": {
"h": 9,
"w": 24,
"x": 0,
"y": 76
},
"hiddenSeries": false,
"id": 135,
"legend": {
"alignAsTable": true,
"avg": true,
"current": true,
"hideEmpty": true,
"hideZero": true,
"max": true,
"min": true,
"rightSide": false,
"show": true,
"sort": "max",
"sortDesc": true,
"total": false,
"values": true
},
"lines": true,
"linewidth": 1,
"links": [],
"nullPointMode": "null",
"options": {
"alertThreshold": true
},
"paceLength": 10,
"percentage": false,
"pluginVersion": "9.2.1",
"pointradius": 5,
"points": false,
"renderer": "flot",
"seriesOverrides": [],
"spaceLength": 10,
"stack": false,
"steppedLine": false,
"targets": [
{
"datasource": "${DS_PROMETHEUS}",
"editorMode": "code",
"expr": "rate(pg_stat_database_tup_fetched{instance=\"$instance\"}[5m])",
"format": "time_series",
"intervalFactor": 1,
"legendFormat": "{{datname}} SELECT (index scan)",
"range": true,
"refId": "A"
},
{
"datasource": "${DS_PROMETHEUS}",
"editorMode": "code",
"expr": "rate(pg_stat_database_tup_returned{instance=\"$instance\"}[5m])",
"format": "time_series",
"intervalFactor": 1,
"legendFormat": "{{datname}} SELECT (table scan)",
"range": true,
"refId": "B"
}
],
"thresholds": [],
"timeRegions": [],
"title": "读取总数",
"tooltip": {
"shared": true,
"sort": 2,
"value_type": "individual"
},
"type": "graph",
"xaxis": {
"mode": "time",
"show": true,
"values": []
},
"yaxes": [
{
"$$hashKey": "object:606",
"format": "short",
"label": "Rows",
"logBase": 1,
"show": true
},
{
"$$hashKey": "object:607",
"format": "short",
"logBase": 1,
"show": true
}
],
"yaxis": {
"align": false
}
},
{
"aliasColors": {},
"bars": false,
"dashLength": 10,
"dashes": false,
"datasource": "${DS_PROMETHEUS}",
"fieldConfig": {
"defaults": {
"links": []
},
"overrides": []
},
"fill": 1,
"fillGradient": 0,
"gridPos": {
"h": 13,
"w": 24,
"x": 0,
"y": 85
},
"hiddenSeries": false,
"id": 5,
"legend": {
"alignAsTable": true,
"avg": true,
"current": true,
"max": false,
"min": false,
"rightSide": false,
"show": true,
"sort": "current",
"sortDesc": true,
"total": true,
"values": true
},
"lines": true,
"linewidth": 1,
"links": [],
"nullPointMode": "null",
"options": {
"alertThreshold": true
},
"percentage": false,
"pluginVersion": "9.2.1",
"pointradius": 5,
"points": false,
"renderer": "flot",
"seriesOverrides": [],
"spaceLength": 10,
"stack": false,
"steppedLine": false,
"targets": [
{
"datasource": "${DS_PROMETHEUS}",
"expr": "pg_stat_database_tup_fetched{datname=~\"$datname\", instance=~\"$instance\"} != 0",
"format": "time_series",
"intervalFactor": 2,
"legendFormat": "{{datname}}",
"refId": "A",
"step": 2
}
],
"thresholds": [],
"timeRegions": [],
"title": "查询数据-有索引",
"tooltip": {
"shared": true,
"sort": 0,
"value_type": "individual"
},
"type": "graph",
"xaxis": {
"mode": "time",
"show": true,
"values": []
},
"yaxes": [
{
"$$hashKey": "object:888",
"format": "bytes",
"logBase": 1,
"show": true
},
{
"$$hashKey": "object:889",
"format": "short",
"logBase": 1,
"show": true
}
],
"yaxis": {
"align": false
}
},
{
"aliasColors": {},
"bars": false,
"dashLength": 10,
"dashes": false,
"datasource": "${DS_PROMETHEUS}",
"fieldConfig": {
"defaults": {
"links": []
},
"overrides": []
},
"fill": 1,
"fillGradient": 0,
"gridPos": {
"h": 11,
"w": 24,
"x": 0,
"y": 98
},
"hiddenSeries": false,
"id": 14,
"legend": {
"alignAsTable": true,
"avg": true,
"current": true,
"max": false,
"min": false,
"rightSide": true,
"show": true,
"sort": "total",
"sortDesc": true,
"total": true,
"values": true
},
"lines": true,
"linewidth": 1,
"links": [],
"nullPointMode": "null",
"options": {
"alertThreshold": true
},
"percentage": false,
"pluginVersion": "9.2.1",
"pointradius": 5,
"points": false,
"renderer": "flot",
"seriesOverrides": [],
"spaceLength": 10,
"stack": false,
"steppedLine": false,
"targets": [
{
"datasource": "${DS_PROMETHEUS}",
"expr": "pg_stat_database_tup_returned{datname=~\"$datname\", instance=~\"$instance\"} != 0",
"format": "time_series",
"intervalFactor": 2,
"legendFormat": "{{datname}}",
"refId": "A",
"step": 2
}
],
"thresholds": [],
"timeRegions": [],
"title": "查询数-全表",
"tooltip": {
"shared": true,
"sort": 0,
"value_type": "individual"
},
"type": "graph",
"xaxis": {
"mode": "time",
"show": true,
"values": []
},
"yaxes": [
{
"$$hashKey": "object:975",
"format": "bytes",
"logBase": 1,
"show": true
},
{
"$$hashKey": "object:976",
"format": "short",
"logBase": 1,
"show": true
}
],
"yaxis": {
"align": false
}
},
{
"aliasColors": {},
"bars": false,
"dashLength": 10,
"dashes": false,
"datasource": "${DS_PROMETHEUS}",
"fill": 1,
"fillGradient": 0,
"gridPos": {
"h": 10,
"w": 24,
"x": 0,
"y": 109
},
"hiddenSeries": false,
"id": 70,
"legend": {
"alignAsTable": true,
"avg": true,
"current": true,
"max": true,
"min": true,
"show": true,
"total": false,
"values": true
},
"lines": true,
"linewidth": 1,
"links": [],
"nullPointMode": "null",
"options": {
"alertThreshold": true
},
"percentage": false,
"pluginVersion": "9.2.1",
"pointradius": 5,
"points": false,
"renderer": "flot",
"seriesOverrides": [],
"spaceLength": 10,
"stack": false,
"steppedLine": false,
"targets": [
{
"datasource": "${DS_PROMETHEUS}",
"editorMode": "code",
"expr": "rate(pg_stat_bgwriter_checkpoint_write_time{instance=\"$instance\"}[$interval]) or irate(pg_stat_bgwriter_checkpoint_write_time_total {instance=\"$instance\"}[5m])",
"format": "time_series",
"intervalFactor": 1,
"legendFormat": "检查点 文件写入磁盘时间",
"range": true,
"refId": "B"
},
{
"datasource": "${DS_PROMETHEUS}",
"editorMode": "code",
"expr": "rate(pg_stat_bgwriter_checkpoint_sync_time{instance=\"$instance\"}[$interval]) or irate(pg_stat_bgwriter_checkpoint_sync_time_total {instance=\"$instance\"}[5m])",
"format": "time_series",
"intervalFactor": 1,
"legendFormat": "检查点文件同步到磁盘时间",
"range": true,
"refId": "A"
}
],
"thresholds": [],
"timeRegions": [],
"title": "检查点状态",
"tooltip": {
"shared": true,
"sort": 0,
"value_type": "individual"
},
"type": "graph",
"xaxis": {
"mode": "time",
"show": true,
"values": []
},
"yaxes": [
{
"$$hashKey": "object:1830",
"format": "ms",
"logBase": 1,
"show": true
},
{
"$$hashKey": "object:1831",
"format": "short",
"logBase": 1,
"show": true
}
],
"yaxis": {
"align": false
}
}
],
"targets": [
{
"datasource": "${DS_PROMETHEUS}",
"refId": "A"
}
],
"title": "数据库状态",
"type": "row"
},
{
"collapsed": true,
"gridPos": {
"h": 1,
"w": 24,
"x": 0,
"y": 4
},
"id": 131,
"panels": [
{
"aliasColors": {},
"bars": false,
"dashLength": 10,
"dashes": false,
"datasource": "${DS_PROMETHEUS}",
"fieldConfig": {
"defaults": {
"links": []
},
"overrides": []
},
"fill": 1,
"fillGradient": 0,
"gridPos": {
"h": 13,
"w": 24,
"x": 0,
"y": 5
},
"hiddenSeries": false,
"id": 60,
"legend": {
"alignAsTable": true,
"avg": true,
"current": true,
"max": false,
"min": false,
"rightSide": true,
"show": true,
"total": true,
"values": true
},
"lines": true,
"linewidth": 1,
"links": [],
"nullPointMode": "null",
"options": {
"alertThreshold": true
},
"percentage": false,
"pluginVersion": "9.2.1",
"pointradius": 5,
"points": false,
"renderer": "flot",
"seriesOverrides": [],
"spaceLength": 10,
"stack": false,
"steppedLine": false,
"targets": [
{
"datasource": "${DS_PROMETHEUS}",
"expr": "irate(pg_stat_database_xact_commit{instance=\"$instance\", datname=~\"$datname\"}[5m])",
"format": "time_series",
"intervalFactor": 1,
"legendFormat": "{{datname}} commits",
"refId": "A"
},
{
"datasource": "${DS_PROMETHEUS}",
"expr": "irate(pg_stat_database_xact_rollback{instance=\"$instance\", datname=~\"$datname\"}[5m])",
"format": "time_series",
"intervalFactor": 1,
"legendFormat": "{{datname}} rollbacks",
"refId": "B"
}
],
"thresholds": [],
"timeRegions": [],
"title": "事务回滚提交情况",
"tooltip": {
"shared": true,
"sort": 0,
"value_type": "individual"
},
"type": "graph",
"xaxis": {
"mode": "time",
"show": true,
"values": []
},
"yaxes": [
{
"$$hashKey": "object:1480",
"format": "short",
"logBase": 1,
"show": true
},
{
"$$hashKey": "object:1481",
"format": "short",
"logBase": 1,
"show": true
}
],
"yaxis": {
"align": false
}
},
{
"aliasColors": {},
"bars": false,
"dashLength": 10,
"dashes": false,
"datasource": "${DS_PROMETHEUS}",
"fieldConfig": {
"defaults": {
"links": []
},
"overrides": []
},
"fill": 1,
"fillGradient": 0,
"gridPos": {
"h": 10,
"w": 24,
"x": 0,
"y": 18
},
"hiddenSeries": false,
"id": 133,
"legend": {
"alignAsTable": true,
"avg": true,
"current": true,
"hideEmpty": true,
"hideZero": true,
"max": true,
"min": true,
"rightSide": true,
"show": true,
"sort": "max",
"sortDesc": true,
"total": false,
"values": true
},
"lines": true,
"linewidth": 1,
"links": [],
"nullPointMode": "null",
"options": {
"alertThreshold": true
},
"paceLength": 10,
"percentage": false,
"pluginVersion": "9.2.1",
"pointradius": 5,
"points": false,
"renderer": "flot",
"seriesOverrides": [],
"spaceLength": 10,
"stack": false,
"steppedLine": false,
"targets": [
{
"datasource": "${DS_PROMETHEUS}",
"expr": "pg_stat_activity_max_tx_duration{instance=\"$instance\"} > 0",
"format": "time_series",
"intervalFactor": 1,
"legendFormat": "{{datname}} max_tx_duration [{{state}}]",
"refId": "A"
}
],
"thresholds": [],
"timeRegions": [],
"title": "长事务",
"tooltip": {
"shared": true,
"sort": 2,
"value_type": "individual"
},
"type": "graph",
"xaxis": {
"mode": "time",
"show": true,
"values": []
},
"yaxes": [
{
"$$hashKey": "object:1743",
"format": "s",
"logBase": 1,
"show": true
},
{
"$$hashKey": "object:1744",
"format": "short",
"logBase": 1,
"show": true
}
],
"yaxis": {
"align": false
}
}
],
"title": "事务状态",
"type": "row"
},
{
"collapsed": true,
"gridPos": {
"h": 1,
"w": 24,
"x": 0,
"y": 5
},
"id": 137,
"panels": [
{
"aliasColors": {},
"bars": false,
"dashLength": 10,
"dashes": false,
"datasource": "${DS_PROMETHEUS}",
"decimals": 0,
"fieldConfig": {
"defaults": {
"links": []
},
"overrides": []
},
"fill": 1,
"fillGradient": 0,
"gridPos": {
"h": 10,
"w": 24,
"x": 0,
"y": 6
},
"hiddenSeries": false,
"id": 3,
"legend": {
"alignAsTable": true,
"avg": true,
"current": true,
"hideEmpty": false,
"max": false,
"min": false,
"rightSide": false,
"show": true,
"sort": "current",
"sortDesc": true,
"total": true,
"values": true
},
"lines": true,
"linewidth": 1,
"links": [],
"nullPointMode": "null",
"options": {
"alertThreshold": true
},
"percentage": false,
"pluginVersion": "9.2.1",
"pointradius": 5,
"points": false,
"renderer": "flot",
"seriesOverrides": [],
"spaceLength": 10,
"stack": false,
"steppedLine": false,
"targets": [
{
"datasource": "${DS_PROMETHEUS}",
"expr": "pg_locks_count{datname=~\"$datname\", instance=~\"$instance\", mode=~\"$mode\"} != 0",
"format": "time_series",
"intervalFactor": 2,
"legendFormat": "{{datname}},{{mode}}",
"refId": "A",
"step": 2
}
],
"thresholds": [],
"timeRegions": [],
"title": "锁表数量",
"tooltip": {
"shared": true,
"sort": 0,
"value_type": "individual"
},
"type": "graph",
"xaxis": {
"mode": "time",
"show": true,
"values": []
},
"yaxes": [
{
"$$hashKey": "object:2673",
"decimals": 0,
"format": "short",
"logBase": 1,
"min": "0",
"show": true
},
{
"$$hashKey": "object:2674",
"format": "short",
"logBase": 1,
"show": true
}
],
"yaxis": {
"align": false
}
},
{
"aliasColors": {},
"bars": false,
"dashLength": 10,
"dashes": false,
"datasource": "${DS_PROMETHEUS}",
"decimals": 0,
"description": "Based on pg_stat_database_conflicts view",
"fieldConfig": {
"defaults": {
"links": []
},
"overrides": []
},
"fill": 2,
"fillGradient": 0,
"gridPos": {
"h": 14,
"w": 24,
"x": 0,
"y": 16
},
"hiddenSeries": false,
"id": 139,
"legend": {
"alignAsTable": true,
"avg": true,
"current": false,
"max": true,
"min": true,
"show": true,
"sort": "avg",
"sortDesc": true,
"total": false,
"values": true
},
"lines": true,
"linewidth": 2,
"links": [],
"nullPointMode": "null",
"options": {
"alertThreshold": true
},
"percentage": false,
"pluginVersion": "9.2.1",
"pointradius": 5,
"points": false,
"renderer": "flot",
"seriesOverrides": [],
"spaceLength": 10,
"stack": false,
"steppedLine": false,
"targets": [
{
"datasource": "${DS_PROMETHEUS}",
"editorMode": "code",
"expr": "sum(rate(pg_stat_database_conflicts_confl_bufferpin{instance=~\"$instance\"}[$interval])) or\nsum(irate(pg_stat_database_conflicts_confl_bufferpin{instance=~\"$instance\"}[5m]))",
"format": "time_series",
"interval": "$interval",
"intervalFactor": 1,
"legendFormat": "由于固定缓冲区而取消的查询数",
"metric": "pg_stat_database_conflicts_confl_bufferpin",
"range": true,
"refId": "A",
"step": 2
},
{
"datasource": "${DS_PROMETHEUS}",
"editorMode": "code",
"expr": "sum(rate(pg_stat_database_conflicts_confl_deadlock{instance=~\"$instance\"}[$interval])) or\nsum(irate(pg_stat_database_conflicts_confl_deadlock{instance=~\"$instance\"}[5m]))",
"format": "time_series",
"interval": "$interval",
"intervalFactor": 1,
"legendFormat": "因死锁而取消的查询数",
"metric": "pg_stat_database_conflicts_confl_bufferpin",
"range": true,
"refId": "B",
"step": 2
},
{
"datasource": "${DS_PROMETHEUS}",
"editorMode": "code",
"expr": "sum(rate(pg_stat_database_conflicts_confl_lock{instance=~\"$instance\"}[$interval])) or\nsum(irate(pg_stat_database_conflicts_confl_lock{instance=~\"$instance\"}[5m]))",
"format": "time_series",
"interval": "$interval",
"intervalFactor": 1,
"legendFormat": "因锁定超时而取消的查询数",
"metric": "pg_stat_database_conflicts_confl_bufferpin",
"range": true,
"refId": "C",
"step": 2
},
{
"datasource": "${DS_PROMETHEUS}",
"editorMode": "code",
"expr": "sum(rate(pg_stat_database_conflicts_confl_snapshot{instance=~\"$instance\"}[$interval])) or\nsum(irate(pg_stat_database_conflicts_confl_snapshot{instance=~\"$instance\"}[5m]))",
"format": "time_series",
"interval": "$interval",
"intervalFactor": 1,
"legendFormat": "因旧快照而取消的查询数",
"metric": "pg_stat_database_conflicts_confl_bufferpin",
"range": true,
"refId": "D",
"step": 2
},
{
"datasource": "${DS_PROMETHEUS}",
"editorMode": "code",
"expr": "sum(rate(pg_stat_database_conflicts_confl_tablespace{instance=~\"$instance\"}[$interval])) or\nsum(irate(pg_stat_database_conflicts_confl_tablespace{instance=~\"$instance\"}[5m]))",
"format": "time_series",
"interval": "$interval",
"intervalFactor": 1,
"legendFormat": "因删除表空间而取消的查询数",
"metric": "pg_stat_database_conflicts_confl_bufferpin",
"range": true,
"refId": "E",
"step": 2
}
],
"thresholds": [],
"timeRegions": [],
"title": "取消查询数",
"tooltip": {
"shared": true,
"sort": 0,
"value_type": "individual"
},
"type": "graph",
"xaxis": {
"mode": "time",
"show": true,
"values": []
},
"yaxes": [
{
"$$hashKey": "object:2930",
"decimals": 0,
"format": "ops",
"logBase": 1,
"min": "0",
"show": true
},
{
"$$hashKey": "object:2931",
"format": "short",
"logBase": 1,
"show": true
}
],
"yaxis": {
"align": false
}
},
{
"aliasColors": {},
"bars": false,
"dashLength": 10,
"dashes": false,
"datasource": "${DS_PROMETHEUS}",
"decimals": 0,
"fill": 1,
"fillGradient": 0,
"gridPos": {
"h": 11,
"w": 24,
"x": 0,
"y": 30
},
"hiddenSeries": false,
"id": 66,
"legend": {
"alignAsTable": true,
"avg": true,
"current": true,
"max": false,
"min": false,
"rightSide": false,
"show": true,
"total": true,
"values": true
},
"lines": true,
"linewidth": 1,
"links": [],
"nullPointMode": "null",
"options": {
"alertThreshold": true
},
"percentage": false,
"pluginVersion": "9.2.1",
"pointradius": 5,
"points": false,
"renderer": "flot",
"seriesOverrides": [],
"spaceLength": 10,
"stack": false,
"steppedLine": false,
"targets": [
{
"datasource": "${DS_PROMETHEUS}",
"editorMode": "code",
"expr": "irate(pg_stat_database_conflicts{instance=\"$instance\", datname=~\"$datname\"}[5m])",
"format": "time_series",
"intervalFactor": 1,
"legendFormat": "{{datname}} 由于恢复冲突而取消的查询数-仅发生在备实例",
"range": true,
"refId": "B"
},
{
"datasource": "${DS_PROMETHEUS}",
"editorMode": "code",
"expr": "irate(pg_stat_database_deadlocks{instance=\"$instance\", datname=~\"$datname\"}[5m])",
"format": "time_series",
"intervalFactor": 1,
"legendFormat": "{{datname}} 死锁",
"range": true,
"refId": "A"
}
],
"thresholds": [],
"timeRegions": [],
"title": "死锁",
"tooltip": {
"shared": true,
"sort": 0,
"value_type": "individual"
},
"type": "graph",
"xaxis": {
"mode": "time",
"show": true,
"values": []
},
"yaxes": [
{
"$$hashKey": "object:1567",
"format": "short",
"logBase": 1,
"min": "0",
"show": true
},
{
"$$hashKey": "object:1568",
"format": "short",
"logBase": 1,
"show": true
}
],
"yaxis": {
"align": false
}
},
{
"aliasColors": {},
"bars": false,
"dashLength": 10,
"dashes": false,
"datasource": "${DS_PROMETHEUS}",
"editable": true,
"error": false,
"fieldConfig": {
"defaults": {
"links": []
},
"overrides": []
},
"fill": 1,
"fillGradient": 0,
"grid": {},
"gridPos": {
"h": 9,
"w": 24,
"x": 0,
"y": 41
},
"hiddenSeries": false,
"id": 141,
"legend": {
"avg": false,
"current": false,
"max": false,
"min": false,
"show": true,
"total": false,
"values": false
},
"lines": true,
"linewidth": 2,
"links": [],
"nullPointMode": "connected",
"options": {
"alertThreshold": true
},
"percentage": false,
"pluginVersion": "9.2.1",
"pointradius": 5,
"points": false,
"renderer": "flot",
"seriesOverrides": [],
"spaceLength": 10,
"stack": false,
"steppedLine": false,
"targets": [
{
"alias": "conflicts",
"datasource": "${DS_PROMETHEUS}",
"dsType": "prometheus",
"editorMode": "code",
"expr": "sum(rate(pg_stat_database_deadlocks{instance=\"$instance\"}[5m]))",
"groupBy": [
{
"params": [
"$interval"
],
"type": "time"
},
{
"params": [
"null"
],
"type": "fill"
}
],
"intervalFactor": 2,
"legendFormat": "deadlocks",
"measurement": "postgresql",
"policy": "default",
"range": true,
"refId": "A",
"resultFormat": "time_series",
"select": [
[
{
"params": [
"conflicts"
],
"type": "field"
},
{
"params": [],
"type": "mean"
},
{
"params": [],
"type": "difference"
}
]
],
"step": 2,
"tags": [
{
"key": "host",
"operator": "=~",
"value": "/^$host$/"
}
]
},
{
"alias": "deadlocks",
"datasource": "${DS_PROMETHEUS}",
"dsType": "prometheus",
"editorMode": "code",
"expr": "sum(rate(pg_stat_database_conflicts{instance=\"$instance\"}[5m]))",
"groupBy": [
{
"params": [
"$interval"
],
"type": "time"
},
{
"params": [
"null"
],
"type": "fill"
}
],
"intervalFactor": 2,
"legendFormat": "conflicts",
"measurement": "postgresql",
"policy": "default",
"range": true,
"refId": "B",
"resultFormat": "time_series",
"select": [
[
{
"params": [
"deadlocks"
],
"type": "field"
},
{
"params": [],
"type": "mean"
},
{
"params": [],
"type": "difference"
}
]
],
"step": 2,
"tags": [
{
"key": "host",
"operator": "=~",
"value": "/^$host$/"
}
]
}
],
"thresholds": [],
"timeRegions": [],
"title": "备实例死锁",
"tooltip": {
"msResolution": false,
"shared": true,
"sort": 0,
"value_type": "cumulative"
},
"type": "graph",
"xaxis": {
"mode": "time",
"show": true,
"values": []
},
"yaxes": [
{
"$$hashKey": "object:1055",
"format": "short",
"logBase": 1,
"min": 0,
"show": true
},
{
"$$hashKey": "object:1056",
"format": "short",
"logBase": 1,
"show": true
}
],
"yaxis": {
"align": false
}
}
],
"title": "表状态",
"type": "row"
},
{
"collapsed": true,
"gridPos": {
"h": 1,
"w": 24,
"x": 0,
"y": 6
},
"id": 145,
"panels": [
{
"aliasColors": {},
"bars": false,
"dashLength": 10,
"dashes": false,
"datasource": "${DS_PROMETHEUS}",
"editable": true,
"error": false,
"fieldConfig": {
"defaults": {
"links": []
},
"overrides": []
},
"fill": 1,
"fillGradient": 0,
"grid": {},
"gridPos": {
"h": 9,
"w": 24,
"x": 0,
"y": 8
},
"hiddenSeries": false,
"id": 143,
"legend": {
"avg": true,
"current": true,
"max": false,
"min": true,
"show": true,
"total": false,
"values": true
},
"lines": true,
"linewidth": 2,
"links": [],
"maxPerRow": 6,
"nullPointMode": "connected",
"options": {
"alertThreshold": true
},
"percentage": true,
"pluginVersion": "9.2.1",
"pointradius": 1,
"points": false,
"renderer": "flot",
"seriesOverrides": [],
"spaceLength": 10,
"stack": false,
"steppedLine": false,
"targets": [
{
"datasource": "${DS_PROMETHEUS}",
"expr": "round(100*sum(pg_stat_database_blks_hit{instance=\"$instance\"}) / (sum(pg_stat_database_blks_hit{instance=\"$instance\"}) + sum(pg_stat_database_blks_read{instance=\"$instance\"})),0.1)",
"hide": false,
"interval": "",
"intervalFactor": 2,
"legendFormat": "pg cache hit rate",
"refId": "A",
"step": 2
}
],
"thresholds": [],
"timeRegions": [],
"title": "绥中池命中率",
"tooltip": {
"msResolution": false,
"shared": true,
"sort": 0,
"value_type": "cumulative"
},
"type": "graph",
"xaxis": {
"mode": "time",
"show": true,
"values": []
},
"yaxes": [
{
"$$hashKey": "object:3959",
"format": "percent",
"logBase": 1,
"max": "100",
"show": true
},
{
"$$hashKey": "object:3960",
"format": "percent",
"label": "",
"logBase": 1,
"max": "100",
"show": true
}
],
"yaxis": {
"align": false
}
},
{
"aliasColors": {},
"bars": false,
"dashLength": 10,
"dashes": false,
"datasource": "${DS_PROMETHEUS}",
"decimals": 2,
"fill": 1,
"fillGradient": 0,
"gridPos": {
"h": 12,
"w": 24,
"x": 0,
"y": 17
},
"hiddenSeries": false,
"id": 62,
"legend": {
"alignAsTable": true,
"avg": true,
"current": true,
"max": false,
"min": false,
"rightSide": false,
"show": true,
"total": false,
"values": true
},
"lines": true,
"linewidth": 1,
"links": [],
"nullPointMode": "null",
"options": {
"alertThreshold": true
},
"percentage": false,
"pluginVersion": "9.2.1",
"pointradius": 5,
"points": false,
"renderer": "flot",
"seriesOverrides": [],
"spaceLength": 10,
"stack": false,
"steppedLine": false,
"targets": [
{
"datasource": "${DS_PROMETHEUS}",
"expr": "pg_stat_database_blks_hit{instance=\"$instance\", datname=~\"$datname\"} / (pg_stat_database_blks_read{instance=\"$instance\", datname=~\"$datname\"} + pg_stat_database_blks_hit{instance=\"$instance\", datname=~\"$datname\"})",
"format": "time_series",
"intervalFactor": 1,
"legendFormat": "{{ datname }}",
"refId": "A"
}
],
"thresholds": [],
"timeRegions": [],
"title": "缓存命中率",
"tooltip": {
"shared": true,
"sort": 0,
"value_type": "individual"
},
"type": "graph",
"xaxis": {
"mode": "time",
"show": true,
"values": []
},
"yaxes": [
{
"$$hashKey": "object:3789",
"decimals": 4,
"format": "percentunit",
"label": "",
"logBase": 1,
"show": true
},
{
"$$hashKey": "object:3790",
"format": "short",
"logBase": 1,
"show": true
}
],
"yaxis": {
"align": false
}
},
{
"aliasColors": {},
"bars": false,
"dashLength": 10,
"dashes": false,
"datasource": "${DS_PROMETHEUS}",
"description": "临时文件存在于 log_temp_files 配置项。",
"fill": 1,
"fillGradient": 0,
"gridPos": {
"h": 10,
"w": 24,
"x": 0,
"y": 29
},
"hiddenSeries": false,
"id": 68,
"legend": {
"alignAsTable": true,
"avg": true,
"current": true,
"max": false,
"min": false,
"rightSide": false,
"show": true,
"total": true,
"values": true
},
"lines": true,
"linewidth": 1,
"links": [],
"nullPointMode": "null",
"options": {
"alertThreshold": true
},
"percentage": false,
"pluginVersion": "9.2.1",
"pointradius": 5,
"points": false,
"renderer": "flot",
"seriesOverrides": [],
"spaceLength": 10,
"stack": false,
"steppedLine": false,
"targets": [
{
"datasource": "${DS_PROMETHEUS}",
"editorMode": "code",
"expr": "rate(pg_stat_database_temp_bytes{instance=\"$instance\", datname=~\"$datname\"}[$interval]) or irate(pg_stat_database_temp_bytes{instance=\"$instance\", datname=~\"$datname\"}[5m])",
"format": "time_series",
"intervalFactor": 1,
"legendFormat": "{{datname}}",
"range": true,
"refId": "A"
}
],
"thresholds": [],
"timeRegions": [],
"title": "临时文件大小",
"tooltip": {
"shared": true,
"sort": 0,
"value_type": "individual"
},
"type": "graph",
"xaxis": {
"mode": "time",
"show": true,
"values": []
},
"yaxes": [
{
"$$hashKey": "object:3702",
"format": "bytes",
"logBase": 1,
"min": "0",
"show": true
},
{
"$$hashKey": "object:3703",
"format": "short",
"logBase": 1,
"show": true
}
],
"yaxis": {
"align": false
}
},
{
"aliasColors": {},
"bars": false,
"dashLength": 10,
"dashes": false,
"datasource": "${DS_PROMETHEUS}",
"fill": 1,
"fillGradient": 0,
"gridPos": {
"h": 11,
"w": 24,
"x": 0,
"y": 39
},
"hiddenSeries": false,
"id": 64,
"legend": {
"alignAsTable": true,
"avg": true,
"current": true,
"max": true,
"min": true,
"rightSide": false,
"show": true,
"total": false,
"values": true
},
"lines": true,
"linewidth": 1,
"links": [],
"nullPointMode": "null",
"options": {
"alertThreshold": true
},
"percentage": false,
"pluginVersion": "9.2.1",
"pointradius": 5,
"points": false,
"renderer": "flot",
"seriesOverrides": [],
"spaceLength": 10,
"stack": false,
"steppedLine": false,
"targets": [
{
"datasource": "${DS_PROMETHEUS}",
"editorMode": "code",
"expr": "rate(pg_stat_bgwriter_buffers_backend_total{instance=\"$instance\"}[$interval]) or irate(pg_stat_bgwriter_buffers_backend_total {instance=\"$instance\"}[5m])",
"format": "time_series",
"intervalFactor": 1,
"legendFormat": "后端直接写入的缓冲区数",
"range": true,
"refId": "A"
},
{
"datasource": "${DS_PROMETHEUS}",
"editorMode": "code",
"expr": "rate(pg_stat_bgwriter_buffers_alloc_total{instance=\"$instance\"}[$interval]) or irate(pg_stat_bgwriter_buffers_alloc_total {instance=\"$instance\"}[5m])",
"format": "time_series",
"intervalFactor": 1,
"legendFormat": "分配的缓冲区数数量",
"range": true,
"refId": "B"
},
{
"datasource": "${DS_PROMETHEUS}",
"editorMode": "code",
"expr": "rate(pg_stat_bgwriter_buffers_backend_fsync_total{instance=\"$instance\"}[$interval]) or irate(pg_stat_bgwriter_buffers_backend_fsync_total {instance=\"$instance\"}[5m])",
"format": "time_series",
"intervalFactor": 1,
"legendFormat": "fsync 调用的次数",
"range": true,
"refId": "C"
},
{
"datasource": "${DS_PROMETHEUS}",
"editorMode": "code",
"expr": "rate(pg_stat_bgwriter_buffers_checkpoint_total{instance=\"$instance\"}[$interval]) or irate(pg_stat_bgwriter_buffers_checkpoint_total{instance=\"$instance\"}[5m])",
"format": "time_series",
"intervalFactor": 1,
"legendFormat": "检查点期间写入的缓冲区数",
"range": true,
"refId": "D"
},
{
"datasource": "${DS_PROMETHEUS}",
"editorMode": "code",
"expr": "rate(pg_stat_bgwriter_buffers_clean_total{instance=\"$instance\"}[$interval]) or irate(pg_stat_bgwriter_buffers_clean_total{instance=\"$instance\"}[5m])",
"format": "time_series",
"intervalFactor": 1,
"legendFormat": "由bgwriter清理的脏块数量",
"range": true,
"refId": "E"
}
],
"thresholds": [],
"timeRegions": [],
"title": "绥中区",
"tooltip": {
"shared": true,
"sort": 0,
"value_type": "individual"
},
"type": "graph",
"xaxis": {
"mode": "time",
"show": true,
"values": []
},
"yaxes": [
{
"$$hashKey": "object:4044",
"format": "short",
"logBase": 1,
"show": true
},
{
"$$hashKey": "object:4045",
"format": "short",
"logBase": 1,
"show": true
}
],
"yaxis": {
"align": false
}
},
{
"aliasColors": {},
"bars": false,
"dashLength": 10,
"dashes": false,
"datasource": "${DS_PROMETHEUS}",
"decimals": 2,
"fieldConfig": {
"defaults": {
"links": []
},
"overrides": []
},
"fill": 2,
"fillGradient": 0,
"gridPos": {
"h": 12,
"w": 24,
"x": 0,
"y": 50
},
"hiddenSeries": false,
"id": 147,
"legend": {
"alignAsTable": true,
"avg": true,
"current": false,
"max": true,
"min": true,
"show": true,
"sort": "avg",
"sortDesc": true,
"total": false,
"values": true
},
"lines": true,
"linewidth": 2,
"links": [],
"nullPointMode": "null",
"options": {
"alertThreshold": true
},
"percentage": false,
"pluginVersion": "9.2.1",
"pointradius": 5,
"points": false,
"renderer": "flot",
"seriesOverrides": [
{
"$$hashKey": "object:4649",
"alias": "/Write */",
"yaxis": 2
}
],
"spaceLength": 10,
"stack": false,
"steppedLine": false,
"targets": [
{
"datasource": "${DS_PROMETHEUS}",
"editorMode": "code",
"expr": "rate(pg_stat_database_blk_read_time{datname=~\"$datname\",instance=~\"$instance\",datname!~\"template.*\"}[5m])",
"format": "time_series",
"interval": "$interval",
"intervalFactor": 1,
"legendFormat": "Read {{datname}}",
"range": true,
"refId": "A"
},
{
"datasource": "${DS_PROMETHEUS}",
"editorMode": "code",
"expr": "rate(pg_stat_database_blk_write_time{datname=~\"$datname\",instance=~\"$instance\",datname!~\"template.*\"}[5m])",
"format": "time_series",
"interval": "$interval",
"intervalFactor": 1,
"legendFormat": "Write {{datname}}",
"range": true,
"refId": "B"
}
],
"thresholds": [],
"timeRegions": [],
"title": "读写数据文件块耗时",
"tooltip": {
"shared": true,
"sort": 0,
"value_type": "individual"
},
"type": "graph",
"xaxis": {
"mode": "time",
"show": true,
"values": []
},
"yaxes": [
{
"$$hashKey": "object:4656",
"decimals": 0,
"format": "rps",
"label": "",
"logBase": 1,
"min": "0",
"show": true
},
{
"$$hashKey": "object:4657",
"decimals": 0,
"format": "wps",
"logBase": 1,
"min": "0",
"show": true
}
],
"yaxis": {
"align": false
}
}
],
"title": "缓存状态",
"type": "row"
},
{
"collapsed": true,
"gridPos": {
"h": 1,
"w": 24,
"x": 0,
"y": 7
},
"id": 161,
"panels": [
{
"columns": [],
"datasource": "${DS_PROMETHEUS}",
"fontSize": "100%",
"gridPos": {
"h": 14,
"w": 24,
"x": 0,
"y": 8
},
"id": 159,
"links": [],
"pageSize": 10,
"scroll": true,
"showHeader": true,
"sort": {
"desc": false
},
"styles": [
{
"$$hashKey": "object:6658",
"alias": "Time",
"align": "auto",
"dateFormat": "YYYY-MM-DD HH:mm:ss",
"pattern": "Time",
"type": "hidden"
},
{
"$$hashKey": "object:6659",
"alias": "",
"align": "auto",
"colors": [
"rgba(245, 54, 54, 0.9)",
"rgba(237, 129, 40, 0.89)",
"rgba(50, 172, 45, 0.97)"
],
"dateFormat": "YYYY-MM-DD HH:mm:ss",
"decimals": 2,
"pattern": "job",
"thresholds": [],
"type": "hidden",
"unit": "short"
},
{
"$$hashKey": "object:6660",
"alias": "",
"align": "auto",
"colors": [
"rgba(245, 54, 54, 0.9)",
"rgba(237, 129, 40, 0.89)",
"rgba(50, 172, 45, 0.97)"
],
"dateFormat": "YYYY-MM-DD HH:mm:ss",
"decimals": 2,
"pattern": "queryid",
"thresholds": [],
"type": "string",
"unit": "short"
},
{
"$$hashKey": "object:6661",
"alias": "",
"align": "auto",
"colors": [
"rgba(245, 54, 54, 0.9)",
"rgba(237, 129, 40, 0.89)",
"rgba(50, 172, 45, 0.97)"
],
"dateFormat": "YYYY-MM-DD HH:mm:ss",
"decimals": 2,
"pattern": "alias",
"thresholds": [],
"type": "hidden",
"unit": "short"
},
{
"$$hashKey": "object:6662",
"alias": "",
"align": "auto",
"colors": [
"rgba(245, 54, 54, 0.9)",
"rgba(237, 129, 40, 0.89)",
"rgba(50, 172, 45, 0.97)"
],
"dateFormat": "YYYY-MM-DD HH:mm:ss",
"decimals": 2,
"pattern": "__name__",
"thresholds": [],
"type": "hidden",
"unit": "short"
},
{
"$$hashKey": "object:6663",
"alias": "",
"align": "auto",
"colors": [
"rgba(245, 54, 54, 0.9)",
"rgba(237, 129, 40, 0.89)",
"rgba(50, 172, 45, 0.97)"
],
"dateFormat": "YYYY-MM-DD HH:mm:ss",
"decimals": 2,
"mappingType": 1,
"pattern": "instance",
"thresholds": [],
"type": "hidden",
"unit": "short"
},
{
"$$hashKey": "object:6664",
"alias": "",
"align": "auto",
"colors": [
"rgba(245, 54, 54, 0.9)",
"rgba(237, 129, 40, 0.89)",
"rgba(50, 172, 45, 0.97)"
],
"dateFormat": "YYYY-MM-DD HH:mm:ss",
"decimals": 2,
"mappingType": 1,
"pattern": "server",
"thresholds": [],
"type": "hidden",
"unit": "short"
}
],
"targets": [
{
"datasource": "${DS_PROMETHEUS}",
"editorMode": "code",
"expr": "topk(50, pg_stat_statements_mean_time_seconds{datname!~\"template.*\", rolname!~\"udb_exporter\", rolname!~\"postgres_exporter\",instance=~\"$instance\", datname=~\"$datname\"})",
"format": "table",
"instant": true,
"intervalFactor": 1,
"legendFormat": "",
"refId": "A"
}
],
"title": "TOP 50 执行时长 ",
"transform": "table",
"type": "table-old"
},
{
"columns": [],
"datasource": "${DS_PROMETHEUS}",
"fontSize": "100%",
"gridPos": {
"h": 13,
"w": 24,
"x": 0,
"y": 22
},
"id": 157,
"links": [],
"pageSize": 10,
"scroll": true,
"showHeader": true,
"sort": {
"desc": false
},
"styles": [
{
"$$hashKey": "object:5786",
"alias": "Time",
"align": "auto",
"dateFormat": "YYYY-MM-DD HH:mm:ss",
"pattern": "Time",
"type": "hidden"
},
{
"$$hashKey": "object:5787",
"alias": "",
"align": "auto",
"colors": [
"rgba(245, 54, 54, 0.9)",
"rgba(237, 129, 40, 0.89)",
"rgba(50, 172, 45, 0.97)"
],
"dateFormat": "YYYY-MM-DD HH:mm:ss",
"decimals": 2,
"pattern": "job",
"thresholds": [],
"type": "hidden",
"unit": "short"
},
{
"$$hashKey": "object:5788",
"alias": "",
"align": "auto",
"colors": [
"rgba(245, 54, 54, 0.9)",
"rgba(237, 129, 40, 0.89)",
"rgba(50, 172, 45, 0.97)"
],
"dateFormat": "YYYY-MM-DD HH:mm:ss",
"decimals": 2,
"pattern": "queryid",
"thresholds": [],
"type": "string",
"unit": "short"
},
{
"$$hashKey": "object:5789",
"alias": "",
"align": "auto",
"colors": [
"rgba(245, 54, 54, 0.9)",
"rgba(237, 129, 40, 0.89)",
"rgba(50, 172, 45, 0.97)"
],
"dateFormat": "YYYY-MM-DD HH:mm:ss",
"decimals": 2,
"pattern": "__name__",
"thresholds": [],
"type": "hidden",
"unit": "short"
},
{
"$$hashKey": "object:5790",
"alias": "",
"align": "auto",
"colors": [
"rgba(245, 54, 54, 0.9)",
"rgba(237, 129, 40, 0.89)",
"rgba(50, 172, 45, 0.97)"
],
"dateFormat": "YYYY-MM-DD HH:mm:ss",
"decimals": 2,
"mappingType": 1,
"pattern": "alias",
"thresholds": [],
"type": "hidden",
"unit": "short"
},
{
"$$hashKey": "object:5791",
"alias": "",
"align": "auto",
"colors": [
"rgba(245, 54, 54, 0.9)",
"rgba(237, 129, 40, 0.89)",
"rgba(50, 172, 45, 0.97)"
],
"dateFormat": "YYYY-MM-DD HH:mm:ss",
"decimals": 2,
"mappingType": 1,
"pattern": "server",
"thresholds": [],
"type": "hidden",
"unit": "short"
},
{
"$$hashKey": "object:5792",
"alias": "",
"align": "auto",
"colors": [
"rgba(245, 54, 54, 0.9)",
"rgba(237, 129, 40, 0.89)",
"rgba(50, 172, 45, 0.97)"
],
"decimals": 2,
"pattern": "/.*/",
"thresholds": [],
"type": "number",
"unit": "short"
}
],
"targets": [
{
"datasource": "${DS_PROMETHEUS}",
"editorMode": "code",
"expr": "topk(50, pg_stat_statements_calls{datname!~\"template.*\", rolname!~\"udb_exporter\",rolname!~\"postgres_exporter\",instance=~\"$instance\", datname=~\"$datname\"})",
"format": "table",
"instant": true,
"intervalFactor": 2,
"legendFormat": "",
"refId": "A"
}
],
"title": "TOP-50 执行数量",
"transform": "table",
"type": "table-old"
},
{
"aliasColors": {},
"bars": false,
"dashLength": 10,
"dashes": false,
"datasource": "${DS_PROMETHEUS}",
"fieldConfig": {
"defaults": {
"links": []
},
"overrides": []
},
"fill": 1,
"fillGradient": 0,
"gridPos": {
"h": 11,
"w": 12,
"x": 0,
"y": 35
},
"hiddenSeries": false,
"id": 165,
"legend": {
"avg": false,
"current": false,
"max": false,
"min": false,
"show": true,
"total": false,
"values": false
},
"lines": true,
"linewidth": 1,
"links": [],
"nullPointMode": "null",
"options": {
"alertThreshold": true
},
"percentage": false,
"pluginVersion": "9.2.1",
"pointradius": 5,
"points": false,
"renderer": "flot",
"seriesOverrides": [],
"spaceLength": 10,
"stack": false,
"steppedLine": false,
"targets": [
{
"datasource": "${DS_PROMETHEUS}",
"editorMode": "code",
"expr": "sum(increase(pg_stat_statements_calls{datname!~\"template.*\", instance=~\"$instance\", datname=~\"$datname\"}[5m])) by (datname)",
"format": "time_series",
"intervalFactor": 2,
"legendFormat": "{{ datname }}",
"range": true,
"refId": "A"
}
],
"thresholds": [],
"timeRegions": [],
"title": "Total queries count (5m rate) by database",
"tooltip": {
"shared": true,
"sort": 0,
"value_type": "individual"
},
"type": "graph",
"xaxis": {
"mode": "time",
"show": true,
"values": []
},
"yaxes": [
{
"$$hashKey": "object:10469",
"format": "short",
"logBase": 1,
"show": true
},
{
"$$hashKey": "object:10470",
"format": "short",
"logBase": 1,
"show": true
}
],
"yaxis": {
"align": false
}
},
{
"aliasColors": {},
"bars": false,
"dashLength": 10,
"dashes": false,
"datasource": "${DS_PROMETHEUS}",
"fieldConfig": {
"defaults": {
"links": []
},
"overrides": []
},
"fill": 1,
"fillGradient": 0,
"gridPos": {
"h": 10,
"w": 12,
"x": 12,
"y": 35
},
"hiddenSeries": false,
"id": 153,
"legend": {
"avg": false,
"current": false,
"max": false,
"min": false,
"show": true,
"total": false,
"values": false
},
"lines": true,
"linewidth": 1,
"links": [],
"nullPointMode": "null",
"options": {
"alertThreshold": true
},
"percentage": false,
"pluginVersion": "9.2.1",
"pointradius": 5,
"points": false,
"renderer": "flot",
"seriesOverrides": [],
"spaceLength": 10,
"stack": false,
"steppedLine": false,
"targets": [
{
"datasource": "${DS_PROMETHEUS}",
"editorMode": "code",
"expr": "sum(increase(pg_stat_statements_calls{datname!~\"template.*\", instance=~\"$instance\", datname=~\"$datname\"}[5m])) by (datname)",
"format": "time_series",
"intervalFactor": 2,
"legendFormat": "{{ instance }}",
"range": true,
"refId": "A"
}
],
"thresholds": [],
"timeRegions": [],
"title": "数据库级5m平均查询耗时",
"tooltip": {
"shared": true,
"sort": 0,
"value_type": "individual"
},
"type": "graph",
"xaxis": {
"mode": "time",
"show": true,
"values": []
},
"yaxes": [
{
"$$hashKey": "object:5021",
"format": "s",
"logBase": 1,
"show": true
},
{
"$$hashKey": "object:5022",
"format": "short",
"logBase": 1,
"show": true
}
],
"yaxis": {
"align": false
}
},
{
"aliasColors": {},
"bars": false,
"dashLength": 10,
"dashes": false,
"datasource": "${DS_PROMETHEUS}",
"fieldConfig": {
"defaults": {
"links": []
},
"overrides": []
},
"fill": 1,
"fillGradient": 0,
"gridPos": {
"h": 11,
"w": 12,
"x": 12,
"y": 45
},
"hiddenSeries": false,
"id": 155,
"legend": {
"avg": false,
"current": false,
"max": false,
"min": false,
"show": true,
"total": false,
"values": false
},
"lines": true,
"linewidth": 1,
"links": [],
"nullPointMode": "null",
"options": {
"alertThreshold": true
},
"percentage": false,
"pluginVersion": "9.2.1",
"pointradius": 5,
"points": false,
"renderer": "flot",
"seriesOverrides": [],
"spaceLength": 10,
"stack": false,
"steppedLine": false,
"targets": [
{
"datasource": "${DS_PROMETHEUS}",
"editorMode": "code",
"exemplar": false,
"expr": "sum(rate(pg_stat_statements_mean_time_seconds{datname!~\"template.*\", instance=~\"$instance\"}[5m]))",
"format": "time_series",
"instant": false,
"intervalFactor": 2,
"legendFormat": "{{instance}}",
"range": true,
"refId": "A"
}
],
"thresholds": [],
"timeRegions": [],
"title": "实例级5m查询总耗时",
"tooltip": {
"shared": true,
"sort": 0,
"value_type": "individual"
},
"type": "graph",
"xaxis": {
"mode": "time",
"show": true,
"values": []
},
"yaxes": [
{
"$$hashKey": "object:5387",
"format": "s",
"logBase": 1,
"show": true
},
{
"$$hashKey": "object:5388",
"format": "short",
"logBase": 1,
"show": true
}
],
"yaxis": {
"align": false
}
},
{
"aliasColors": {},
"bars": false,
"dashLength": 10,
"dashes": false,
"datasource": "${DS_PROMETHEUS}",
"fieldConfig": {
"defaults": {
"links": []
},
"overrides": []
},
"fill": 1,
"fillGradient": 0,
"gridPos": {
"h": 10,
"w": 12,
"x": 0,
"y": 46
},
"hiddenSeries": false,
"id": 163,
"legend": {
"avg": false,
"current": false,
"max": false,
"min": false,
"show": true,
"total": false,
"values": false
},
"lines": true,
"linewidth": 1,
"links": [],
"nullPointMode": "null",
"options": {
"alertThreshold": true
},
"percentage": false,
"pluginVersion": "9.2.1",
"pointradius": 5,
"points": false,
"renderer": "flot",
"seriesOverrides": [],
"spaceLength": 10,
"stack": false,
"steppedLine": false,
"targets": [
{
"datasource": "${DS_PROMETHEUS}",
"editorMode": "code",
"expr": "sum(increase(pg_stat_statements_calls{datname!~\"template.*\", instance=~\"$instance\"}[5m])) by (instance)",
"format": "time_series",
"intervalFactor": 2,
"legendFormat": "{{instance}}",
"range": true,
"refId": "A"
}
],
"thresholds": [],
"timeRegions": [],
"title": "Total queries count (5m rate) by entire instance",
"tooltip": {
"shared": true,
"sort": 0,
"value_type": "individual"
},
"type": "graph",
"xaxis": {
"mode": "time",
"show": true,
"values": []
},
"yaxes": [
{
"$$hashKey": "object:10644",
"format": "short",
"logBase": 1,
"show": true
},
{
"$$hashKey": "object:10645",
"format": "short",
"logBase": 1,
"show": true
}
],
"yaxis": {
"align": false
}
}
],
"title": "查询统计",
"type": "row"
},
{
"collapsed": true,
"gridPos": {
"h": 1,
"w": 24,
"x": 0,
"y": 8
},
"id": 151,
"panels": [
{
"aliasColors": {},
"bars": false,
"dashLength": 10,
"dashes": false,
"datasource": "${DS_PROMETHEUS}",
"fieldConfig": {
"defaults": {
"links": []
},
"overrides": []
},
"fill": 1,
"fillGradient": 0,
"gridPos": {
"h": 9,
"w": 24,
"x": 0,
"y": 9
},
"hiddenSeries": false,
"id": 149,
"legend": {
"avg": false,
"current": false,
"max": false,
"min": false,
"show": true,
"total": false,
"values": false
},
"lines": true,
"linewidth": 1,
"links": [],
"nullPointMode": "null",
"options": {
"alertThreshold": true
},
"percentage": false,
"pluginVersion": "9.2.1",
"pointradius": 5,
"points": false,
"renderer": "flot",
"seriesOverrides": [],
"spaceLength": 10,
"stack": false,
"steppedLine": false,
"targets": [
{
"datasource": "${DS_PROMETHEUS}",
"editorMode": "code",
"expr": "rate(pg_replication_lag{instance=\"$instance\"}[5m])",
"format": "time_series",
"intervalFactor": 2,
"legendFormat": "{{instance}}",
"metric": "pg_replication_lag",
"range": true,
"refId": "A",
"step": 2
}
],
"thresholds": [],
"timeRegions": [],
"title": "复制延迟",
"tooltip": {
"shared": true,
"sort": 0,
"value_type": "individual"
},
"type": "graph",
"xaxis": {
"mode": "time",
"show": true,
"values": []
},
"yaxes": [
{
"$$hashKey": "object:4936",
"format": "s",
"logBase": 1,
"show": true
},
{
"$$hashKey": "object:4937",
"format": "short",
"logBase": 1,
"show": false
}
],
"yaxis": {
"align": false
}
}
],
"title": "从实例状态",
"type": "row"
}
],
"refresh": "5s",
"schemaVersion": 37,
"style": "dark",
"tags": [
"db",
"stats",
"udb"
],
"templating": {
"list": [
{
"current": {
"selected": false,
"text": "Prometheus",
"value": "Prometheus"
},
"hide": 0,
"includeAll": false,
"label": "datasource",
"multi": false,
"name": "DS_PROMETHEUS",
"options": [],
"query": "prometheus",
"queryValue": "",
"refresh": 1,
"regex": "",
"skipUrlSync": false,
"type": "datasource"
},
{
"auto": true,
"auto_count": 200,
"auto_min": "1s",
"current": {
"selected": false,
"text": "5m",
"value": "5m"
},
"hide": 0,
"label": "Interval",
"name": "interval",
"options": [
{
"selected": false,
"text": "auto",
"value": "$__auto_interval_interval"
},
{
"selected": false,
"text": "1s",
"value": "1s"
},
{
"selected": false,
"text": "5s",
"value": "5s"
},
{
"selected": false,
"text": "1m",
"value": "1m"
},
{
"selected": true,
"text": "5m",
"value": "5m"
},
{
"selected": false,
"text": "1h",
"value": "1h"
},
{
"selected": false,
"text": "6h",
"value": "6h"
},
{
"selected": false,
"text": "1d",
"value": "1d"
}
],
"query": "1s,5s,1m,5m,1h,6h,1d",
"queryValue": "",
"refresh": 2,
"skipUrlSync": false,
"type": "interval"
},
{
"current": {
"isNone": true,
"selected": false,
"text": "None",
"value": ""
},
"datasource": "${DS_PROMETHEUS}",
"definition": "",
"hide": 2,
"includeAll": false,
"label": "Namespace",
"multi": false,
"name": "namespace",
"options": [],
"query": {
"query": "query_result(pg_exporter_last_scrape_duration_seconds)",
"refId": "Prometheus-namespace-Variable-Query"
},
"refresh": 2,
"regex": "/.*kubernetes_namespace=\"([^\"]+).*/",
"skipUrlSync": false,
"sort": 1,
"tagValuesQuery": "",
"tagsQuery": "",
"type": "query",
"useTags": false
},
{
"current": {
"isNone": true,
"selected": false,
"text": "None",
"value": ""
},
"datasource": "${DS_PROMETHEUS}",
"definition": "",
"hide": 2,
"includeAll": false,
"label": "Release",
"multi": false,
"name": "release",
"options": [],
"query": {
"query": "query_result(pg_exporter_last_scrape_duration_seconds{kubernetes_namespace=\"$namespace\"})",
"refId": "Prometheus-release-Variable-Query"
},
"refresh": 2,
"regex": "/.*release=\"([^\"]+)/",
"skipUrlSync": false,
"sort": 1,
"tagValuesQuery": "",
"tagsQuery": "",
"type": "query",
"useTags": false
},
{
"current": {
"selected": false,
"text": "udbtx-22.4.21",
"value": "udbtx-22.4.21"
},
"datasource": "${DS_PROMETHEUS}",
"definition": "",
"hide": 0,
"includeAll": false,
"label": "Instance",
"multi": false,
"name": "instance",
"options": [],
"query": {
"query": "query_result(pg_up{release=\"$release\"})",
"refId": "Prometheus-instance-Variable-Query"
},
"refresh": 1,
"regex": "/.*instance=\"([^\"]+).*/",
"skipUrlSync": false,
"sort": 1,
"tagValuesQuery": "",
"tagsQuery": "",
"type": "query",
"useTags": false
},
{
"current": {
"selected": false,
"text": "All",
"value": "$__all"
},
"datasource": "${DS_PROMETHEUS}",
"definition": "",
"hide": 0,
"includeAll": true,
"label": "Database",
"multi": true,
"name": "datname",
"options": [],
"query": {
"query": "label_values(datname)",
"refId": "Prometheus-datname-Variable-Query"
},
"refresh": 1,
"regex": "",
"skipUrlSync": false,
"sort": 1,
"tagValuesQuery": "",
"tagsQuery": "",
"type": "query",
"useTags": false
},
{
"current": {
"selected": false,
"text": "All",
"value": "$__all"
},
"datasource": "${DS_PROMETHEUS}",
"definition": "label_values({mode=~\"accessexclusivelock|accesssharelock|exclusivelock|rowexclusivelock|rowsharelock|sharelock|sharerowexclusivelock|shareupdateexclusivelock\"}, mode)",
"hide": 0,
"includeAll": true,
"label": "Lock table",
"multi": true,
"name": "mode",
"options": [],
"query": {
"query": "label_values({mode=~\"accessexclusivelock|accesssharelock|exclusivelock|rowexclusivelock|rowsharelock|sharelock|sharerowexclusivelock|shareupdateexclusivelock\"}, mode)",
"refId": "StandardVariableQuery"
},
"refresh": 1,
"regex": "",
"skipUrlSync": false,
"sort": 0,
"tagValuesQuery": "",
"tagsQuery": "",
"type": "query",
"useTags": false
}
]
},
"time": {
"from": "now-3h",
"to": "now"
},
"timepicker": {
"refresh_intervals": [
"5s",
"10s",
"30s",
"1m",
"5m",
"15m",
"30m",
"1h",
"2h",
"1d"
],
"time_options": [
"5m",
"15m",
"1h",
"6h",
"12h",
"24h",
"2d",
"7d",
"30d"
]
},
"timezone": "",
"title": "UDB Database",
"version": 24,
"weekStart": ""
}
异常处理
监控指标页面提示 was collected before with the same name and label values
原因
存在相同的指标和值,一般是由自定义指标引起的
解决
select pg_stat_statements_reset(); --重置pg_stat_statements统计数据
报警规则参考
报警规则配置文件通常位于prometheus的prometheus/conf/rules/目录; 以下是udb.rules参考示例
groups:
- name: udb 监控告警
  rules:
  - alert: 警报!Udb宕机
    expr: pg_up == 0
    for: 0m
    labels:
      severity: 严重告警
    annotations:
      summary: "{{$labels.instance}} Udb down"
      description: "Udb instance is down\n  当前值={{ $value }}"
  - alert: 警报!Udb被重启
    expr: time() - pg_postmaster_start_time_seconds < 60
    for: 0m
    labels:
      severity: 严重告警
    annotations:
      summary: "{{$labels.instance}} Udb restarted"
      description: "Udb restarted\n  当前值={{ $value }}"
  - alert: 警报!Udb ExporterError
    expr: pg_exporter_last_scrape_error > 0
    for: 0m
    labels:
      severity: 严重告警
    annotations:
      summary: "{{$labels.instance}} Udb exporter error"
      description: "Udb exporter is showing errors. A query may be buggy in query.yaml\n  当前值={{ $value }}"
  - alert: 警报!Udb主从复制不同步
    expr: pg_replication_lag > 30 and ON(instance) pg_replication_is_replica == 1
    for: 0m
    labels:
      severity: 严重告警
    annotations:
      summary: "{{$labels.instance}} Udb replication lag"
      description: "Udb replication lag is going up (> 30s)\n  当前值={{ $value }}"
  - alert: 警报!Udb TableNotVaccumed
    expr: time() - pg_stat_user_tables_last_autovacuum > 60 * 60 * 24
    for: 0m
    labels:
      severity: 一般告警
    annotations:
      summary: "{{$labels.instance}} Udb table not vaccumed"
      description: "Table has not been vaccum for 24 hours\n  当前值={{ $value }}"
  - alert: 警报!Udb TableNotAnalyzed
    expr: time() - pg_stat_user_tables_last_autoanalyze > 60 * 60 * 24
    for: 0m
    labels:
      severity: 一般告警
    annotations:
      summary: "{{$labels.instance}} Udb table not analyzed"
      description: "Table has not been analyzed for 24 hours\n  当前值={{ $value }}"
  - alert: 警报!Udb连接数太多
    expr: sum by (datname) (pg_stat_activity_count{datname!~"template.*|postgres"}) > pg_settings_max_connections * 0.8
    for: 2m
    labels:
      severity: 一般告警
    annotations:
      summary: "{{$labels.instance}} Udb too many connections"
      description: "Udb instance has too many connections (> 80%).\n  当前值={{ $value }}"
  - alert: 警报!Udb连接数太少
    expr: sum by (datname) (pg_stat_activity_count{datname!~"template.*|postgres"}) < 5
    for: 2m
    labels:
      severity: 一般告警
    annotations:
      summary: "{{$labels.instance}} Udb not enough connections"
      description: "Udb instance should have more connections (> 5)\n  当前值={{ $value }}"
  - alert: 警报!Udb死锁
    expr: increase(pg_stat_database_deadlocks{datname!~"template.*|postgres"}[1m]) > 5
    for: 0m
    labels:
      severity: 一般告警
    annotations:
      summary: "{{$labels.instance}} Udb dead locks"
      description: "Udb has dead-locks\n  当前值={{ $value }}"
  - alert: 警报!Udb慢查询
    expr: pg_slow_queries > 0
    for: 2m
    labels:
      severity: 一般告警
    annotations:
      summary: "{{$labels.instance}} Udb slow queries"
      description: "Udb executes slow queries\n  当前值={{ $value }}"
  - alert: 警报!Udb回滚率高
    expr: rate(pg_stat_database_xact_rollback{datname!~"template.*"}[3m]) / rate(pg_stat_database_xact_commit{datname!~"template.*"}[3m]) > 0.02
    for: 0m
    labels:
      severity: 一般告警
    annotations:
      summary: "{{$labels.instance}} Udb high rollback rate"
      description: "Ratio of transactions being aborted compared to committed is > 2 %\n  当前值={{ $value }}"
  - alert: 警报!Udb提交率低
    expr: rate(pg_stat_database_xact_commit[1m]) < 10
    for: 2m
    labels:
      severity: 严重告警
    annotations:
      summary: "{{$labels.instance}} Udb commit rate low"
      description: "Udb  seems to be processing very few transactions\n  当前值={{ $value }}"
  - alert: 警报!Udb LowXidConsumption
    expr: rate(pg_txid_current[1m]) < 5
    for: 2m
    labels:
      severity: 一般告警
    annotations:
      summary: "{{$labels.instance}} Udb low XID consumption"
      description: "Udb seems to be consuming transaction IDs very slowly\n  当前值={{ $value }}"
  - alert: 警报!Udb lowXlogConsumption
    expr: rate(pg_xlog_position_bytes[1m]) < 100
    for: 2m
    labels:
      severity: 一般告警
    annotations:
      summary: "{{$labels.instance}} Udblow XLOG consumption"
      description: "Udb  seems to be consuming XLOG very slowly\n  当前值={{ $value }}"
  - alert: 警报!Udb WaleReplicationStopped
    expr: rate(pg_xlog_position_bytes[1m]) == 0
    for: 0m
    labels:
      severity: 严重告警
    annotations:
      summary: "{{$labels.instance}} Udb WALE replication stopped"
      description: "WAL-E replication seems to be stopped\n  当前值={{ $value }}"
  - alert: 警报!Udb HighRateStatementTimeout
    expr: rate(postgresql_errors_total{type="statement_timeout"}[1m]) > 3
    for: 0m
    labels:
      severity: 严重告警
    annotations:
      summary: "{{$labels.instance}} Udb high rate statement timeout"
      description: "Udb  transactions showing high rate of statement timeouts\n  当前值={{ $value }}"
  - alert: 警报!Udb HighRateDeadlock
    expr: increase(postgresql_errors_total{type="deadlock_detected"}[1m]) > 1
    for: 0m
    labels:
      severity: 严重告警
    annotations:
      summary: "{{$labels.instance}} Udb high rate deadlock"
      description: "Udb  detected deadlocks\n  当前值={{ $value }}"
  - alert: 警报!Udb ReplicationLagBytes
    expr: (pg_xlog_position_bytes and pg_replication_is_replica == 0) - on(environment) group_right(instance) (pg_xlog_position_bytes and pg_replication_is_replica == 1) > 1e+09
    for: 0m
    labels:
      severity: 严重告警
    annotations:
      summary: "{{$labels.instance}} Udb replication lag bytes"
      description: "Udb  Replication lag (in bytes) is high\n  当前值={{ $value }}"
  - alert: 警报!Udb UnusedReplicationSlot
    expr: pg_replication_slots_active == 0
    for: 1m
    labels:
      severity: 一般告警
    annotations:
      summary: "{{$labels.instance}} Udb unused replication slot"
      description: "Unused Replication Slots\n  当前值={{ $value }}"
  - alert: 警报!Udb TooManyDeadTuples
    expr: ((pg_stat_user_tables_n_dead_tup > 10000) / (pg_stat_user_tables_n_live_tup + pg_stat_user_tables_n_dead_tup)) >= 0.1 unless ON(instance) (pg_replication_is_replica == 1)
    for: 2m
    labels:
      severity: 一般告警
    annotations:
      summary: "{{$labels.instance}} Udb too many dead tuples"
      description: "Udb dead tuples is too large\n  当前值={{ $value }}"
  - alert: 警报!Udb SplitBrain
    expr: count(pg_replication_is_replica == 0) != 1
    for: 0m
    labels:
      severity: 严重告警
    annotations:
      summary: "{{$labels.instance}} Udb split brain"
      description: "Split Brain, too many primary Udb databases in read-write mode\n  当前值={{ $value }}"
  - alert: 警报!Udb PromotedNode
    expr: pg_replication_is_replica and changes(pg_replication_is_replica[1m]) > 0
    for: 0m
    labels:
      severity: 一般告警
    annotations:
      summary: "{{$labels.instance}} Udb promoted node"
      description: "Udb standby server has been promoted as primary node\n  当前值={{ $value }}"
  - alert: 警报!Udb SslCompressionActive
    expr: sum(pg_stat_ssl_compression) > 0
    for: 0m
    labels:
      severity: 严重告警
    annotations:
      summary: "{{$labels.instance}} Udb SSL compression active"
      description: "Database connections with SSL compression enabled. This may add significant jitter in replication delay. Replicas should turn off SSL compression via `sslcompression=0` in `recovery.conf`.\n  当前值={{ $value }}"
  - alert: 警报!Udb TooManyLocksAcquired
    expr: ((sum (pg_locks_count)) / (pg_settings_max_locks_per_transaction * pg_settings_max_connections)) > 0.20
    for: 2m
    labels:
      severity: 严重告警
    annotations:
      summary: "{{$labels.instance}} Udb too many locks acquired"
      description: "Too many locks acquired on the database. If this alert happens frequently, we may need to increase the udb  setting max_locks_per_transaction.\n  当前值={{ $value }}"
监控指标说明
#go_* 指标为exporter自己的指标
#HELP pg_database_size_bytes Disk space used by the database #TYPE pg_database_size_bytes gauge #查看数据库占用磁盘大小 #相关sql函数:
playboy=> select pg_database.datname, pg_database_size(pg_database.datname) AS size from pg_database;    //查看所有数据库的大小
datname  |  size
-----------+---------
 unvdb     | 3621512
 playboy   | 3637896
 template1 | 3563524
 template0 | 3563524
(4 rows)
playboy=> select pg_size_pretty(pg_database_size('playboy'));      //以KB,MB,GB的方式来查看数据库大小
 pg_size_pretty
----------------
 3553 kB
(1 row)
#异常处理:如果数据库所占空间巨大,可以尝试通过unvdb的vancuum函数进行垃圾回收,如果仍然不能解决,那么只能采用重启的方式进行解决。 pg_database_size_bytes{datname=”template0”,server=”192.168.2.81:5678”} 8.585731e+06 pg_database_size_bytes{datname=”template1”,server=”192.168.2.81:5678”} 8.585731e+06 pg_database_size_bytes{datname=”test”,server=”192.168.2.81:5678”} 8.930083e+06 pg_database_size_bytes{datname=”unvdb”,server=”192.168.2.81:5678”} 5.92134947e+08 ……
#HELP pg_exporter_last_scrape_duration_seconds Duration of the last scrape of metrics from PostgreSQL. #TYPE pg_exporter_last_scrape_duration_seconds gauge #功能:监控工具上次抓取持续时间,单位是秒 pg_exporter_last_scrape_duration_seconds 0.066103733
#HELP pg_exporter_last_scrape_error Whether the last scrape of metrics from PostgreSQL resulted in an error (1 for error, 0 for success). #TYPE pg_exporter_last_scrape_error gauge #功能:监控工具上次抓取是否出现错误,1为出错,0为成功 pg_exporter_last_scrape_error 0
#HELP pg_exporter_scrapes_total Total number of times PostgreSQL was scraped for metrics. #TYPE pg_exporter_scrapes_total counter #功能:监控工具采集总次数 pg_exporter_scrapes_total 56
#HELP pg_exporter_user_queries_load_error Whether the user queries file was loaded and parsed successfully (1 for error, 0 for success). #TYPE pg_exporter_user_queries_load_error gauge #功能:用户自定义查询文件加载是否成功 pg_exporter_user_queries_load_error{filename=”/queries.yaml”,hashsum=”a5e3d4ed9ff8618ed23aac3c5f2eb859f85000feee49e827dc0da1d20b341f8d”} 0
#HELP pg_locks_count Number of locks #TYPE pg_locks_count gauge #功能:锁计数 pg_locks_count{datname=”unvdb”,mode=”accessexclusivelock”,server=”192.168.2.81:5678”} 0 pg_locks_count{datname=”unvdb”,mode=”accesssharelock”,server=”192.168.2.81:5678”} 1 pg_locks_count{datname=”unvdb”,mode=”exclusivelock”,server=”192.168.2.81:5678”} 0 pg_locks_count{datname=”unvdb”,mode=”rowexclusivelock”,server=”192.168.2.81:5678”} 0 pg_locks_count{datname=”unvdb”,mode=”rowsharelock”,server=”192.168.2.81:5678”} 0 pg_locks_count{datname=”unvdb”,mode=”sharelock”,server=”192.168.2.81:5678”} 0 pg_locks_count{datname=”unvdb”,mode=”sharerowexclusivelock”,server=”192.168.2.81:5678”} 0 pg_locks_count{datname=”unvdb”,mode=”shareupdateexclusivelock”,server=”192.168.2.81:5678”} 0 pg_locks_count{datname=”unvdb”,mode=”sireadlock”,server=”192.168.2.81:5678”} 0
#HELP pg_postmaster_start_time_seconds Time at which postmaster started #TYPE pg_postmaster_start_time_seconds gauge #数据库启动时的时间戳,当前时间-此时间戳=运行时长 pg_postmaster_start_time_seconds{server=”192.168.2.81:5678”} 1.666942766e+09
#HELP pg_process_idle_seconds Idle time of server processes #TYPE pg_process_idle_seconds histogram #功能:空闲进程统计 #sql示例:SELECT application_name, SUM(EXTRACT(EPOCH FROM (CURRENT_TIMESTAMP - state_change))::bigint)::float AS process_idle_seconds_sum, COUNT(*) AS process_idle_seconds_count FROM pg_stat_activity WHERE state = ‘idle’ GROUP BY application_name; #空闲进程过多会占用连接数有可能导致连接数不足,导致正常连接失败 pg_process_idle_seconds_sum{application_name=””,server=”192.168.2.81:5678”} 96 pg_process_idle_seconds_count{application_name=””,server=”192.168.2.81:5678”} 11
#HELP pg_replication_lag Replication lag behind master in seconds #TYPE pg_replication_lag gauge #主从延迟秒数 #SELECT CASE WHEN NOT pg_is_in_recovery() THEN 0 ELSE GREATEST (0, EXTRACT(EPOCH FROM (now() - pg_last_xact_replay_timestamp()))) END AS lag; #过高的值说明从库出现延迟 pg_replication_lag{server=”192.168.2.81:5678”} 0
#HELP pg_replication_slots_active Flag indicating if the slot is active #TYPE pg_replication_slots_active gauge #复制槽状态 #SELECT slot_name, database, active, pg_wal_lsn_diff(pg_current_wal_lsn(), restart_lsn) FROM pg_replication_slots; pg_replication_slots_active{database=””,server=”192.168.2.81:5678”,slot_name=”ph_slot”} 0
#HELP pg_replication_slots_pg_wal_lsn_diff Replication lag in bytes #TYPE pg_replication_slots_pg_wal_lsn_diff gauge #复制槽延迟字节点 #SELECT slot_name, database, active, pg_wal_lsn_diff(pg_current_wal_lsn(), restart_lsn) FROM pg_replication_slots; pg_replication_slots_pg_wal_lsn_diff{database=””,server=”192.168.2.81:5678”,slot_name=”ph_slot”} 1.727004672e+09
#HELP pg_scrape_collector_duration_seconds postgres_exporter: Duration of a collector scrape. #TYPE pg_scrape_collector_duration_seconds gauge #监控工具抓取的持续时间 pg_scrape_collector_duration_seconds{collector=”bgwriter”} 0.010715143 pg_scrape_collector_duration_seconds{collector=”database”} 0.01228562
#HELP pg_scrape_collector_success postgres_exporter: Whether a collector succeeded. #TYPE pg_scrape_collector_success gauge #监控工具抓取是否成功 pg_scrape_collector_success{collector=”bgwriter”} 1 pg_scrape_collector_success{collector=”database”} 1
#HELP pg_settings_allow_system_table_mods Allows modifications of the structure of system tables. #TYPE pg_settings_allow_system_table_mods gauge #设置允许系统表mods,以下settings都可以用show xxx sql语句查询。 #sql示例:show allow_system_table_mods; pg_settings_allow_system_table_mods{server=”192.168.2.81:5678”} 0
#HELP pg_settings_archive_timeout_seconds Forces a switch to the next WAL file if a new file has not been started within N seconds. [Units converted to seconds.] #TYPE pg_settings_archive_timeout_seconds gauge #系统设置的归档超时秒数 pg_settings_archive_timeout_seconds{server=”192.168.2.81:5678”} 60
#HELP pg_settings_array_nulls Enable input of NULL elements in arrays. #TYPE pg_settings_array_nulls gauge #系统array_nulls 配置是否允许数组中包含空值 pg_settings_array_nulls{server=”192.168.2.81:5678”} 1
#HELP pg_settings_authentication_timeout_seconds Sets the maximum allowed time to complete client authentication. [Units converted to seconds.] #TYPE pg_settings_authentication_timeout_seconds gauge #系统设置的认证超时秒数 pg_settings_authentication_timeout_seconds{server=”192.168.2.81:5678”} 60
#HELP pg_settings_autovacuum Starts the autovacuum subprocess. #TYPE pg_settings_autovacuum gauge #系统设置是否开启自动清理 pg_settings_autovacuum{server=”192.168.2.81:5678”} 1
#HELP pg_settings_autovacuum_analyze_scale_factor Number of tuple inserts, updates, or deletes prior to analyze as a fraction of reltuples. #TYPE pg_settings_autovacuum_analyze_scale_factor gauge #系统设置的自动清理因子 pg_settings_autovacuum_analyze_scale_factor{server=”192.168.2.81:5678”} 0.1
#HELP pg_settings_autovacuum_analyze_threshold Minimum number of tuple inserts, updates, or deletes prior to analyze. #TYPE pg_settings_autovacuum_analyze_threshold gauge #系统设置的自动分析进程数 pg_settings_autovacuum_analyze_threshold{server=”192.168.2.81:5678”} 50
#HELP pg_settings_autovacuum_freeze_max_age Age at which to autovacuum a table to prevent transaction ID wraparound. #TYPE pg_settings_autovacuum_freeze_max_age gauge #系统设置的自动清理空闲最大值 #show autovacuum_freeze_max_age; pg_settings_autovacuum_freeze_max_age{server=”192.168.2.81:5678”} 2e+08
#HELP pg_settings_autovacuum_max_workers Sets the maximum number of simultaneously running autovacuum worker processes. #TYPE pg_settings_autovacuum_max_workers gauge #系统设置的自动清理最大工作进程 pg_settings_autovacuum_max_workers{server=”192.168.2.81:5678”} 3
#HELP pg_settings_autovacuum_multixact_freeze_max_age Multixact age at which to autovacuum a table to prevent multixact wraparound. #TYPE pg_settings_autovacuum_multixact_freeze_max_age gauge #指定在一个VACUUM操作被强制执行来防止表中多事务ID回卷之前,一个表的pg_class.relminmxid域能保持的最大年龄 #即便自动清理被禁用,系统也将发起自动清理进程来阻止回卷。 pg_settings_autovacuum_multixact_freeze_max_age{server=”192.168.2.81:5678”} 4e+08
#HELP pg_settings_autovacuum_naptime_seconds Time to sleep between autovacuum runs. [Units converted to seconds.] #TYPE pg_settings_autovacuum_naptime_seconds gauge #自动清理休眠秒数 pg_settings_autovacuum_naptime_seconds{server=”192.168.2.81:5678”} 60
#HELP pg_settings_autovacuum_vacuum_cost_delay_seconds Vacuum cost delay in milliseconds, for autovacuum. [Units converted to seconds.] #TYPE pg_settings_autovacuum_vacuum_cost_delay_seconds gauge #自动清理延迟秒数 pg_settings_autovacuum_vacuum_cost_delay_seconds{server=”192.168.2.81:5678”} 0.002
#HELP pg_settings_autovacuum_vacuum_cost_limit Vacuum cost amount available before napping, for autovacuum. #TYPE pg_settings_autovacuum_vacuum_cost_limit gauge #自动清理最大执行时间 pg_settings_autovacuum_vacuum_cost_limit{server=”192.168.2.81:5678”} -1
#HELP pg_settings_autovacuum_vacuum_insert_scale_factor Number of tuple inserts prior to vacuum as a fraction of reltuples. #TYPE pg_settings_autovacuum_vacuum_insert_scale_factor gauge #当元组插入达到表的百分之多少时,开始自动清理。默认是0.2,表示 20% pg_settings_autovacuum_vacuum_insert_scale_factor{server=”192.168.2.81:5678”} 0.2
#HELP pg_settings_autovacuum_vacuum_insert_threshold Minimum number of tuple inserts prior to vacuum, or -1 to disable insert vacuums. #TYPE pg_settings_autovacuum_vacuum_insert_threshold gauge #当元组插入达到多少行时,开始自动清理。默认是1000 pg_settings_autovacuum_vacuum_insert_threshold{server=”192.168.2.81:5678”} 1000
#HELP pg_settings_autovacuum_vacuum_scale_factor Number of tuple updates or deletes prior to vacuum as a fraction of reltuples. #TYPE pg_settings_autovacuum_vacuum_scale_factor gauge #当元组更新或删除达到表的百分之多少时,开始自动清理。默认是0.2,表示 20% pg_settings_autovacuum_vacuum_scale_factor{server=”192.168.2.81:5678”} 0.2
#HELP pg_settings_autovacuum_vacuum_threshold Minimum number of tuple updates or deletes prior to vacuum. #TYPE pg_settings_autovacuum_vacuum_threshold gauge #自动清理线程数 pg_settings_autovacuum_vacuum_threshold{server=”192.168.2.81:5678”} 50
#HELP pg_settings_autovacuum_work_mem_bytes Sets the maximum memory to be used by each autovacuum worker process. [Units converted to bytes.] #TYPE pg_settings_autovacuum_work_mem_bytes gauge #自动清理工作内存占用大小 pg_settings_autovacuum_work_mem_bytes{server=”192.168.2.81:5678”} -1
#HELP pg_settings_backend_flush_after_bytes Number of pages after which previously performed writes are flushed to disk. [Units converted to bytes.] #TYPE pg_settings_backend_flush_after_bytes gauge #当后端缓冲区写入数量超过此值时,强制刷入磁盘,0表示禁用强制写回磁盘 pg_settings_backend_flush_after_bytes{server=”192.168.2.81:5678”} 0
#HELP pg_settings_bgwriter_delay_seconds Background writer sleep time between rounds. [Units converted to seconds.] #TYPE pg_settings_bgwriter_delay_seconds gauge #设置bgwriter延迟秒 pg_settings_bgwriter_delay_seconds{server=”192.168.2.81:5678”} 0.2
#HELP pg_settings_bgwriter_flush_after_bytes Number of pages after which previously performed writes are flushed to disk. [Units converted to bytes.] #TYPE pg_settings_bgwriter_flush_after_bytes gauge #设置bgwriter强制刷入磁盘的字节数 pg_settings_bgwriter_flush_after_bytes{server=”192.168.2.81:5678”} 524288
#HELP pg_settings_bgwriter_lru_maxpages Background writer maximum number of LRU pages to flush per round. #TYPE pg_settings_bgwriter_lru_maxpages gauge #后台写入器每轮要刷新的最大 LRU 页数 pg_settings_bgwriter_lru_maxpages{server=”192.168.2.81:5678”} 100
#HELP pg_settings_bgwriter_lru_multiplier Multiple of the average buffer usage to free per round. #TYPE pg_settings_bgwriter_lru_multiplier gauge #每轮释放的平均缓冲区使用量的倍数 pg_settings_bgwriter_lru_multiplier{server=”192.168.2.81:5678”} 2
#HELP pg_settings_block_size Shows the size of a disk block. #TYPE pg_settings_block_size gauge #磁盘块大小 pg_settings_block_size{server=”192.168.2.81:5678”} 8192
#HELP pg_settings_bonjour Enables advertising the server via Bonjour. #TYPE pg_settings_bonjour gauge #是否启动通过Bonjour宣传服务器的存在 pg_settings_bonjour{server=”192.168.2.81:5678”} 0
#HELP pg_settings_check_function_bodies Check routine bodies during CREATE FUNCTION and CREATE PROCEDURE. #TYPE pg_settings_check_function_bodies gauge #是否开启在 CREATE FUNCTION 和 CREATE PROCEDURE 期间检查例程主体 pg_settings_check_function_bodies{server=”192.168.2.81:5678”} 1
#HELP pg_settings_checkpoint_completion_target Time spent flushing dirty buffers during checkpoint, as fraction of checkpoint interval. #TYPE pg_settings_checkpoint_completion_target gauge #指定检查点完成的目标,作为检查点之间总时间的一部分。默认值为 0.9,它将检查点分布在几乎所有可用的时间间隔中,提供相当一致的 I/O 负载,同时也为检查点完成开销留出一些时间。不建议减小此参数,因为它会导致检查点更快地完成。这会导致检查点期间的 I/O 速率更高,然后在检查点完成和下一个计划检查点之间的 I/O 时间段较少。此参数只能在unvdbsvr.conf文件或服务器命令行中设置。 pg_settings_checkpoint_completion_target{server=”192.168.2.81:5678”} 0.9
#HELP pg_settings_checkpoint_flush_after_bytes Number of pages after which previously performed writes are flushed to disk. [Units converted to bytes.] #TYPE pg_settings_checkpoint_flush_after_bytes gauge #每当在执行检查点时写入超过此数量的数据时,尝试强制操作系统将这些写入发出到底层存储 pg_settings_checkpoint_flush_after_bytes{server=”192.168.2.81:5678”} 262144
#HELP pg_settings_checkpoint_timeout_seconds Sets the maximum time between automatic WAL checkpoints. [Units converted to seconds.] #TYPE pg_settings_checkpoint_timeout_seconds gauge #自动 WAL 检查点之间的最长时间,默认值为五分钟。增加此参数可以增加崩溃恢复所需的时间 pg_settings_checkpoint_timeout_seconds{server=”192.168.2.81:5678”} 300
#HELP pg_settings_checkpoint_warning_seconds Enables warnings if checkpoint segments are filled more frequently than this. [Units converted to seconds.] #TYPE pg_settings_checkpoint_warning_seconds gauge #如果检查点段的填充频率高于此值,则启用警告,默认值为 30 秒 pg_settings_checkpoint_warning_seconds{server=”192.168.2.81:5678”} 30
#HELP pg_settings_client_connection_check_interval_seconds Sets the time interval between checks for disconnection while running queries. [Units converted to seconds.] #TYPE pg_settings_client_connection_check_interval_seconds gauge #客户端断开连接的时间间隔,默认为0,禁用连接检查 pg_settings_client_connection_check_interval_seconds{server=”192.168.2.81:5678”} 0
#HELP pg_settings_commit_delay Sets the delay in microseconds between transaction commit and flushing WAL to disk. #TYPE pg_settings_commit_delay gauge #设置事务提交和将 WAL 刷新到磁盘之间的延迟(以微秒为单位)。在启动 WAL 刷新之前添加时间延迟 pg_settings_commit_delay{server=”192.168.2.81:5678”} 0
#HELP pg_settings_commit_siblings Sets the minimum concurrent open transactions before performing commit_delay. #TYPE pg_settings_commit_siblings gauge #设置执行 commit_delay 之前的最小并发事务 pg_settings_commit_siblings{server=”192.168.2.81:5678”} 5
#HELP pg_settings_cpu_index_tuple_cost Sets the planner’s estimate of the cost of processing each index entry during an index scan. #TYPE pg_settings_cpu_index_tuple_cost gauge #索引扫描期间处理每个索引条目的成本的估计 pg_settings_cpu_index_tuple_cost{server=”192.168.2.81:5678”} 0.005
#HELP pg_settings_cpu_operator_cost Sets the planner’s estimate of the cost of processing each operator or function call. #TYPE pg_settings_cpu_operator_cost gauge #处理每个运算符或函数调用的成本的估计 pg_settings_cpu_operator_cost{server=”192.168.2.81:5678”} 0.0025
#HELP pg_settings_cpu_tuple_cost Sets the planner’s estimate of the cost of processing each tuple (row). #TYPE pg_settings_cpu_tuple_cost gauge #处理每个元组(行)的成本的估计 pg_settings_cpu_tuple_cost{server=”192.168.2.81:5678”} 0.01
#HELP pg_settings_cursor_tuple_fraction Sets the planner’s estimate of the fraction of a cursor’s rows that will be retrieved. #TYPE pg_settings_cursor_tuple_fraction gauge #将被检索游标行的分数的估计 pg_settings_cursor_tuple_fraction{server=”192.168.2.81:5678”} 0.1
#HELP pg_settings_data_checksums Shows whether data checksums are turned on for this cluster. #TYPE pg_settings_data_checksums gauge #是否开启数据校验 pg_settings_data_checksums{server=”192.168.2.81:5678”} 0
#HELP pg_settings_data_directory_mode Shows the mode of the data directory. #TYPE pg_settings_data_directory_mode gauge #数据目录权限值 pg_settings_data_directory_mode{server=”192.168.2.81:5678”} 700
#HELP pg_settings_data_sync_retry Whether to continue running after a failure to sync data files. #TYPE pg_settings_data_sync_retry gauge #数据文件同步失败后是否继续运行 pg_settings_data_sync_retry{server=”192.168.2.81:5678”} 0
#HELP pg_settings_db_user_namespace Enables per-database user names. #TYPE pg_settings_db_user_namespace gauge #是否启用每个数据库的用户名空间 pg_settings_db_user_namespace{server=”192.168.2.81:5678”} 0
#HELP pg_settings_deadlock_timeout_seconds Sets the time to wait on a lock before checking for deadlock. [Units converted to seconds.] #TYPE pg_settings_deadlock_timeout_seconds gauge #检查死锁之前等待锁的时间,默认值为1秒 pg_settings_deadlock_timeout_seconds{server=”192.168.2.81:5678”} 1
#HELP pg_settings_debug_assertions Shows whether the running server has assertion checks enabled. #TYPE pg_settings_debug_assertions gauge #打开各种debug检查 pg_settings_debug_assertions{server=”192.168.2.81:5678”} 0
#HELP pg_settings_debug_discard_caches Aggressively flush system caches for debugging purposes. #TYPE pg_settings_debug_discard_caches gauge #积极刷新系统缓存以进行调试,当尝试触发涉及并发目录更改的难以重现的错误时,此参数非常有用,但在其他情况下很少需要它。 pg_settings_debug_discard_caches{server=”192.168.2.81:5678”} 0
#HELP pg_settings_debug_pretty_print Indents parse and plan tree displays. #TYPE pg_settings_debug_pretty_print gauge #输出易读的debug调试信息 pg_settings_debug_pretty_print{server=”192.168.2.81:5678”} 1
#HELP pg_settings_debug_print_parse Logs each query’s parse tree. #TYPE pg_settings_debug_print_parse gauge #打印生成的解析树、查询重写器输出或每个已执行查询的执行计划。 pg_settings_debug_print_parse{server=”192.168.2.81:5678”} 0
#HELP pg_settings_debug_print_plan Logs each query’s execution plan. #TYPE pg_settings_debug_print_plan gauge #记录每个查询的执行计划 pg_settings_debug_print_plan{server=”192.168.2.81:5678”} 0
#HELP pg_settings_debug_print_rewritten Logs each query’s rewritten parse tree. #TYPE pg_settings_debug_print_rewritten gauge #记录每个查询的重写解析树 pg_settings_debug_print_rewritten{server=”192.168.2.81:5678”} 0
#HELP pg_settings_default_statistics_target Sets the default statistics target. #TYPE pg_settings_default_statistics_target gauge #默认统计分析目标表的列数,默认为100,较大的值会增加执行ANALYZE所需的时间,但可能会提高规划者估计的质量 pg_settings_default_statistics_target{server=”192.168.2.81:5678”} 100
#HELP pg_settings_default_transaction_deferrable Sets the default deferrable status of new transactions. #TYPE pg_settings_default_transaction_deferrable gauge #设置新交易的默认延期状态 #在serializable隔离级别运行时,可延迟的只读 SQL 事务可能会在被允许继续之前被延迟。然而,一旦它开始执行,它就不会产生任何确保可串行化所需的开销;因此序列化代码没有理由因为并发更新而强制中止它,这使得该选项适用于长时间运行的只读事务。 pg_settings_default_transaction_deferrable{server=”192.168.2.81:5678”} 0
#HELP pg_settings_default_transaction_read_only Sets the default read-only status of new transactions. #TYPE pg_settings_default_transaction_read_only gauge #只读 SQL 事务不能更改非临时表。此参数控制每个新事务的默认只读状态。默认值为off(读/写) pg_settings_default_transaction_read_only{server=”192.168.2.81:5678”} 0
#HELP pg_settings_effective_cache_size_bytes Sets the planner’s assumption about the total size of the data caches. [Units converted to bytes.] #TYPE pg_settings_effective_cache_size_bytes gauge #设置规划器对单个查询可用的磁盘缓存的有效大小 pg_settings_effective_cache_size_bytes{server=”192.168.2.81:5678”} 4.294967296e+09
#HELP pg_settings_effective_io_concurrency Number of simultaneous requests that can be handled efficiently by the disk subsystem. #TYPE pg_settings_effective_io_concurrency gauge #磁盘子系统可以有效处理的并发请求数 #设置UDB期望可以同时执行的并发磁盘 I/O 操作的数量。提高此值将增加任何单个UDB会话尝试并行启动的 I/O 操作的数量。允许的范围是 1 到 1000,或者为零以禁用异步 I/O 请求的发出。目前,此设置仅影响位图堆扫描。 pg_settings_effective_io_concurrency{server=”192.168.2.81:5678”} 1
#HELP pg_settings_enable_async_append Enables the planner’s use of async append plans. #TYPE pg_settings_enable_async_append gauge #启用或禁用查询计划器对异步感知追加计划类型的使用 pg_settings_enable_async_append{server=”192.168.2.81:5678”} 1
#HELP pg_settings_enable_bitmapscan Enables the planner’s use of bitmap-scan plans. #TYPE pg_settings_enable_bitmapscan gauge #启用或禁用查询计划器对位图扫描 pg_settings_enable_bitmapscan{server=”192.168.2.81:5678”} 1
#HELP pg_settings_enable_gathermerge Enables the planner’s use of gather merge plans. #TYPE pg_settings_enable_gathermerge gauge #启用或禁用查询计划器对收集合并计划类型的使用 pg_settings_enable_gathermerge{server=”192.168.2.81:5678”} 1
#HELP pg_settings_enable_hashagg Enables the planner’s use of hashed aggregation plans. #TYPE pg_settings_enable_hashagg gauge #启用或禁用查询计划器对散列聚合计划类型的使用 pg_settings_enable_hashagg{server=”192.168.2.81:5678”} 1
#HELP pg_settings_enable_hashjoin Enables the planner’s use of hash join plans. #TYPE pg_settings_enable_hashjoin gauge #启用或禁用查询计划器对散列连接计划类型的使用 pg_settings_enable_hashjoin{server=”192.168.2.81:5678”} 1
#HELP pg_settings_enable_incremental_sort Enables the planner’s use of incremental sort steps. #TYPE pg_settings_enable_incremental_sort gauge pg_settings_enable_incremental_sort{server=”192.168.2.81:5678”} 1
#HELP pg_settings_enable_indexonlyscan Enables the planner’s use of index-only-scan plans. #TYPE pg_settings_enable_indexonlyscan gauge pg_settings_enable_indexonlyscan{server=”192.168.2.81:5678”} 1
#HELP pg_settings_enable_indexscan Enables the planner’s use of index-scan plans. #TYPE pg_settings_enable_indexscan gauge pg_settings_enable_indexscan{server=”192.168.2.81:5678”} 1
#HELP pg_settings_enable_material Enables the planner’s use of materialization. #TYPE pg_settings_enable_material gauge pg_settings_enable_material{server=”192.168.2.81:5678”} 1
#HELP pg_settings_enable_memoize Enables the planner’s use of memoization. #TYPE pg_settings_enable_memoize gauge pg_settings_enable_memoize{server=”192.168.2.81:5678”} 1
#HELP pg_settings_enable_mergejoin Enables the planner’s use of merge join plans. #TYPE pg_settings_enable_mergejoin gauge pg_settings_enable_mergejoin{server=”192.168.2.81:5678”} 1
#HELP pg_settings_enable_nestloop Enables the planner’s use of nested-loop join plans. #TYPE pg_settings_enable_nestloop gauge pg_settings_enable_nestloop{server=”192.168.2.81:5678”} 1
#HELP pg_settings_enable_parallel_append Enables the planner’s use of parallel append plans. #TYPE pg_settings_enable_parallel_append gauge pg_settings_enable_parallel_append{server=”192.168.2.81:5678”} 1
#HELP pg_settings_enable_parallel_hash Enables the planner’s use of parallel hash plans. #TYPE pg_settings_enable_parallel_hash gauge pg_settings_enable_parallel_hash{server=”192.168.2.81:5678”} 1
#HELP pg_settings_enable_partition_pruning Enables plan-time and execution-time partition pruning. #TYPE pg_settings_enable_partition_pruning gauge pg_settings_enable_partition_pruning{server=”192.168.2.81:5678”} 1
#HELP pg_settings_enable_partitionwise_aggregate Enables partitionwise aggregation and grouping. #TYPE pg_settings_enable_partitionwise_aggregate gauge pg_settings_enable_partitionwise_aggregate{server=”192.168.2.81:5678”} 0
#HELP pg_settings_enable_partitionwise_join Enables partitionwise join. #TYPE pg_settings_enable_partitionwise_join gauge pg_settings_enable_partitionwise_join{server=”192.168.2.81:5678”} 0
#HELP pg_settings_enable_seqscan Enables the planner’s use of sequential-scan plans. #TYPE pg_settings_enable_seqscan gauge pg_settings_enable_seqscan{server=”192.168.2.81:5678”} 1
#HELP pg_settings_enable_sort Enables the planner’s use of explicit sort steps. #TYPE pg_settings_enable_sort gauge pg_settings_enable_sort{server=”192.168.2.81:5678”} 1
#HELP pg_settings_enable_tidscan Enables the planner’s use of TID scan plans. #TYPE pg_settings_enable_tidscan gauge pg_settings_enable_tidscan{server=”192.168.2.81:5678”} 1
#HELP pg_settings_escape_string_warning Warn about backslash escapes in ordinary string literals. #TYPE pg_settings_escape_string_warning gauge pg_settings_escape_string_warning{server=”192.168.2.81:5678”} 1
#HELP pg_settings_exit_on_error Terminate session on any error. #TYPE pg_settings_exit_on_error gauge pg_settings_exit_on_error{server=”192.168.2.81:5678”} 0
#HELP pg_settings_extra_float_digits Sets the number of digits displayed for floating-point values. #TYPE pg_settings_extra_float_digits gauge pg_settings_extra_float_digits{server=”192.168.2.81:5678”} 2
#HELP pg_settings_from_collapse_limit Sets the FROM-list size beyond which subqueries are not collapsed. #TYPE pg_settings_from_collapse_limit gauge pg_settings_from_collapse_limit{server=”192.168.2.81:5678”} 8
#HELP pg_settings_fsync Forces synchronization of updates to disk. #TYPE pg_settings_fsync gauge pg_settings_fsync{server=”192.168.2.81:5678”} 1
#HELP pg_settings_full_page_writes Writes full pages to WAL when first modified after a checkpoint. #TYPE pg_settings_full_page_writes gauge pg_settings_full_page_writes{server=”192.168.2.81:5678”} 1
#HELP pg_settings_geqo Enables genetic query optimization. #TYPE pg_settings_geqo gauge pg_settings_geqo{server=”192.168.2.81:5678”} 1
#HELP pg_settings_geqo_effort GEQO: effort is used to set the default for other GEQO parameters. #TYPE pg_settings_geqo_effort gauge pg_settings_geqo_effort{server=”192.168.2.81:5678”} 5
#HELP pg_settings_geqo_generations GEQO: number of iterations of the algorithm. #TYPE pg_settings_geqo_generations gauge pg_settings_geqo_generations{server=”192.168.2.81:5678”} 0
#HELP pg_settings_geqo_pool_size GEQO: number of individuals in the population. #TYPE pg_settings_geqo_pool_size gauge pg_settings_geqo_pool_size{server=”192.168.2.81:5678”} 0
#HELP pg_settings_geqo_seed GEQO: seed for random path selection. #TYPE pg_settings_geqo_seed gauge pg_settings_geqo_seed{server=”192.168.2.81:5678”} 0
#HELP pg_settings_geqo_selection_bias GEQO: selective pressure within the population. #TYPE pg_settings_geqo_selection_bias gauge pg_settings_geqo_selection_bias{server=”192.168.2.81:5678”} 2
#HELP pg_settings_geqo_threshold Sets the threshold of FROM items beyond which GEQO is used. #TYPE pg_settings_geqo_threshold gauge pg_settings_geqo_threshold{server=”192.168.2.81:5678”} 12
#HELP pg_settings_gin_fuzzy_search_limit Sets the maximum allowed result for exact search by GIN. #TYPE pg_settings_gin_fuzzy_search_limit gauge pg_settings_gin_fuzzy_search_limit{server=”192.168.2.81:5678”} 0
#HELP pg_settings_gin_pending_list_limit_bytes Sets the maximum size of the pending list for GIN index. [Units converted to bytes.] #TYPE pg_settings_gin_pending_list_limit_bytes gauge pg_settings_gin_pending_list_limit_bytes{server=”192.168.2.81:5678”} 4.194304e+06
#HELP pg_settings_hash_mem_multiplier Multiple of work_mem to use for hash tables. #TYPE pg_settings_hash_mem_multiplier gauge pg_settings_hash_mem_multiplier{server=”192.168.2.81:5678”} 1
#HELP pg_settings_hot_standby Allows connections and queries during recovery. #TYPE pg_settings_hot_standby gauge pg_settings_hot_standby{server=”192.168.2.81:5678”} 1
#HELP pg_settings_hot_standby_feedback Allows feedback from a hot standby to the primary that will avoid query conflicts. #TYPE pg_settings_hot_standby_feedback gauge pg_settings_hot_standby_feedback{server=”192.168.2.81:5678”} 0
#HELP pg_settings_huge_page_size_bytes The size of huge page that should be requested. [Units converted to bytes.] #TYPE pg_settings_huge_page_size_bytes gauge pg_settings_huge_page_size_bytes{server=”192.168.2.81:5678”} 0
#HELP pg_settings_idle_in_transaction_session_timeout_seconds Sets the maximum allowed idle time between queries, when in a transaction. [Units converted to seconds.] #TYPE pg_settings_idle_in_transaction_session_timeout_seconds gauge pg_settings_idle_in_transaction_session_timeout_seconds{server=”192.168.2.81:5678”} 0
#HELP pg_settings_idle_session_timeout_seconds Sets the maximum allowed idle time between queries, when not in a transaction. [Units converted to seconds.] #TYPE pg_settings_idle_session_timeout_seconds gauge pg_settings_idle_session_timeout_seconds{server=”192.168.2.81:5678”} 0
#HELP pg_settings_ignore_checksum_failure Continues processing after a checksum failure. #TYPE pg_settings_ignore_checksum_failure gauge pg_settings_ignore_checksum_failure{server=”192.168.2.81:5678”} 0
#HELP pg_settings_ignore_invalid_pages Continues recovery after an invalid pages failure. #TYPE pg_settings_ignore_invalid_pages gauge pg_settings_ignore_invalid_pages{server=”192.168.2.81:5678”} 0
#HELP pg_settings_ignore_system_indexes Disables reading from system indexes. #TYPE pg_settings_ignore_system_indexes gauge pg_settings_ignore_system_indexes{server=”192.168.2.81:5678”} 0
#HELP pg_settings_in_hot_standby Shows whether hot standby is currently active. #TYPE pg_settings_in_hot_standby gauge pg_settings_in_hot_standby{server=”192.168.2.81:5678”} 0
#HELP pg_settings_integer_datetimes Shows whether datetimes are integer based. #TYPE pg_settings_integer_datetimes gauge pg_settings_integer_datetimes{server=”192.168.2.81:5678”} 1
#HELP pg_settings_jit Allow JIT compilation. #TYPE pg_settings_jit gauge pg_settings_jit{server=”192.168.2.81:5678”} 1
#HELP pg_settings_jit_above_cost Perform JIT compilation if query is more expensive. #TYPE pg_settings_jit_above_cost gauge pg_settings_jit_above_cost{server=”192.168.2.81:5678”} 100000
#HELP pg_settings_jit_debugging_support Register JIT-compiled functions with debugger. #TYPE pg_settings_jit_debugging_support gauge pg_settings_jit_debugging_support{server=”192.168.2.81:5678”} 0
#HELP pg_settings_jit_dump_bitcode Write out LLVM bitcode to facilitate JIT debugging. #TYPE pg_settings_jit_dump_bitcode gauge pg_settings_jit_dump_bitcode{server=”192.168.2.81:5678”} 0
#HELP pg_settings_jit_expressions Allow JIT compilation of expressions. #TYPE pg_settings_jit_expressions gauge pg_settings_jit_expressions{server=”192.168.2.81:5678”} 1
#HELP pg_settings_jit_inline_above_cost Perform JIT inlining if query is more expensive. #TYPE pg_settings_jit_inline_above_cost gauge pg_settings_jit_inline_above_cost{server=”192.168.2.81:5678”} 500000
#HELP pg_settings_jit_optimize_above_cost Optimize JIT-compiled functions if query is more expensive. #TYPE pg_settings_jit_optimize_above_cost gauge pg_settings_jit_optimize_above_cost{server=”192.168.2.81:5678”} 500000
#HELP pg_settings_jit_profiling_support Register JIT-compiled functions with perf profiler. #TYPE pg_settings_jit_profiling_support gauge pg_settings_jit_profiling_support{server=”192.168.2.81:5678”} 0
#HELP pg_settings_jit_tuple_deforming Allow JIT compilation of tuple deforming. #TYPE pg_settings_jit_tuple_deforming gauge pg_settings_jit_tuple_deforming{server=”192.168.2.81:5678”} 1
#HELP pg_settings_join_collapse_limit Sets the FROM-list size beyond which JOIN constructs are not flattened. #TYPE pg_settings_join_collapse_limit gauge pg_settings_join_collapse_limit{server=”192.168.2.81:5678”} 8
#HELP pg_settings_krb_caseins_users Sets whether Kerberos and GSSAPI user names should be treated as case-insensitive. #TYPE pg_settings_krb_caseins_users gauge pg_settings_krb_caseins_users{server=”192.168.2.81:5678”} 0
#HELP pg_settings_lo_compat_privileges Enables backward compatibility mode for privilege checks on large objects. #TYPE pg_settings_lo_compat_privileges gauge pg_settings_lo_compat_privileges{server=”192.168.2.81:5678”} 0
#HELP pg_settings_lock_timeout_seconds Sets the maximum allowed duration of any wait for a lock. [Units converted to seconds.] #TYPE pg_settings_lock_timeout_seconds gauge pg_settings_lock_timeout_seconds{server=”192.168.2.81:5678”} 0
#HELP pg_settings_log_autovacuum_min_duration_seconds Sets the minimum execution time above which autovacuum actions will be logged. [Units converted to seconds.] #TYPE pg_settings_log_autovacuum_min_duration_seconds gauge pg_settings_log_autovacuum_min_duration_seconds{server=”192.168.2.81:5678”} -1
#HELP pg_settings_log_checkpoints Logs each checkpoint. #TYPE pg_settings_log_checkpoints gauge pg_settings_log_checkpoints{server=”192.168.2.81:5678”} 1
#HELP pg_settings_log_connections Logs each successful connection. #TYPE pg_settings_log_connections gauge pg_settings_log_connections{server=”192.168.2.81:5678”} 1
#HELP pg_settings_log_disconnections Logs end of a session, including duration. #TYPE pg_settings_log_disconnections gauge pg_settings_log_disconnections{server=”192.168.2.81:5678”} 1
#HELP pg_settings_log_duration Logs the duration of each completed SQL statement. #TYPE pg_settings_log_duration gauge pg_settings_log_duration{server=”192.168.2.81:5678”} 1
#HELP pg_settings_log_executor_stats Writes executor performance statistics to the server log. #TYPE pg_settings_log_executor_stats gauge pg_settings_log_executor_stats{server=”192.168.2.81:5678”} 0
#HELP pg_settings_log_file_mode Sets the file permissions for log files. #TYPE pg_settings_log_file_mode gauge pg_settings_log_file_mode{server=”192.168.2.81:5678”} 600
#HELP pg_settings_log_hostname Logs the host name in the connection logs. #TYPE pg_settings_log_hostname gauge pg_settings_log_hostname{server=”192.168.2.81:5678”} 0
#HELP pg_settings_log_lock_waits Logs long lock waits. #TYPE pg_settings_log_lock_waits gauge pg_settings_log_lock_waits{server=”192.168.2.81:5678”} 1
#HELP pg_settings_log_min_duration_sample_seconds Sets the minimum execution time above which a sample of statements will be logged. Sampling is determined by log_statement_sample_rate. [Units converted to seconds.] #TYPE pg_settings_log_min_duration_sample_seconds gauge pg_settings_log_min_duration_sample_seconds{server=”192.168.2.81:5678”} -1
#HELP pg_settings_log_min_duration_statement_seconds Sets the minimum execution time above which all statements will be logged. [Units converted to seconds.] #TYPE pg_settings_log_min_duration_statement_seconds gauge pg_settings_log_min_duration_statement_seconds{server=”192.168.2.81:5678”} 0.001
#HELP pg_settings_log_parameter_max_length_bytes When logging statements, limit logged parameter values to first N bytes. [Units converted to bytes.] #TYPE pg_settings_log_parameter_max_length_bytes gauge pg_settings_log_parameter_max_length_bytes{server=”192.168.2.81:5678”} -1
#HELP pg_settings_log_parameter_max_length_on_error_bytes When reporting an error, limit logged parameter values to first N bytes. [Units converted to bytes.] #TYPE pg_settings_log_parameter_max_length_on_error_bytes gauge pg_settings_log_parameter_max_length_on_error_bytes{server=”192.168.2.81:5678”} 0
#HELP pg_settings_log_parser_stats Writes parser performance statistics to the server log. #TYPE pg_settings_log_parser_stats gauge pg_settings_log_parser_stats{server=”192.168.2.81:5678”} 0
#HELP pg_settings_log_planner_stats Writes planner performance statistics to the server log. #TYPE pg_settings_log_planner_stats gauge pg_settings_log_planner_stats{server=”192.168.2.81:5678”} 0
#HELP pg_settings_log_recovery_conflict_waits Logs standby recovery conflict waits. #TYPE pg_settings_log_recovery_conflict_waits gauge pg_settings_log_recovery_conflict_waits{server=”192.168.2.81:5678”} 0
#HELP pg_settings_log_replication_commands Logs each replication command. #TYPE pg_settings_log_replication_commands gauge pg_settings_log_replication_commands{server=”192.168.2.81:5678”} 0
#HELP pg_settings_log_rotation_age_seconds Automatic log file rotation will occur after N minutes. [Units converted to seconds.] #TYPE pg_settings_log_rotation_age_seconds gauge pg_settings_log_rotation_age_seconds{server=”192.168.2.81:5678”} 86400
#HELP pg_settings_log_rotation_size_bytes Automatic log file rotation will occur after N kilobytes. [Units converted to bytes.] #TYPE pg_settings_log_rotation_size_bytes gauge pg_settings_log_rotation_size_bytes{server=”192.168.2.81:5678”} 0
#HELP pg_settings_log_statement_sample_rate Fraction of statements exceeding log_min_duration_sample to be logged. #TYPE pg_settings_log_statement_sample_rate gauge pg_settings_log_statement_sample_rate{server=”192.168.2.81:5678”} 1
#HELP pg_settings_log_statement_stats Writes cumulative performance statistics to the server log. #TYPE pg_settings_log_statement_stats gauge pg_settings_log_statement_stats{server=”192.168.2.81:5678”} 0
#HELP pg_settings_log_temp_files_bytes Log the use of temporary files larger than this number of kilobytes. [Units converted to bytes.] #TYPE pg_settings_log_temp_files_bytes gauge pg_settings_log_temp_files_bytes{server=”192.168.2.81:5678”} -1
#HELP pg_settings_log_transaction_sample_rate Sets the fraction of transactions from which to log all statements. #TYPE pg_settings_log_transaction_sample_rate gauge pg_settings_log_transaction_sample_rate{server=”192.168.2.81:5678”} 0
#HELP pg_settings_log_truncate_on_rotation Truncate existing log files of same name during log rotation. #TYPE pg_settings_log_truncate_on_rotation gauge pg_settings_log_truncate_on_rotation{server=”192.168.2.81:5678”} 1
#HELP pg_settings_logging_collector Start a subprocess to capture stderr output and/or csvlogs into log files. #TYPE pg_settings_logging_collector gauge pg_settings_logging_collector{server=”192.168.2.81:5678”} 1
#HELP pg_settings_logical_decoding_work_mem_bytes Sets the maximum memory to be used for logical decoding. [Units converted to bytes.] #TYPE pg_settings_logical_decoding_work_mem_bytes gauge pg_settings_logical_decoding_work_mem_bytes{server=”192.168.2.81:5678”} 6.7108864e+07
#HELP pg_settings_maintenance_io_concurrency A variant of effective_io_concurrency that is used for maintenance work. #TYPE pg_settings_maintenance_io_concurrency gauge pg_settings_maintenance_io_concurrency{server=”192.168.2.81:5678”} 10
#HELP pg_settings_maintenance_work_mem_bytes Sets the maximum memory to be used for maintenance operations. [Units converted to bytes.] #TYPE pg_settings_maintenance_work_mem_bytes gauge pg_settings_maintenance_work_mem_bytes{server=”192.168.2.81:5678”} 6.7108864e+07
#HELP pg_settings_max_connections Sets the maximum number of concurrent connections. #TYPE pg_settings_max_connections gauge pg_settings_max_connections{server=”192.168.2.81:5678”} 10000
#HELP pg_settings_max_files_per_process Sets the maximum number of simultaneously open files for each server process. #TYPE pg_settings_max_files_per_process gauge pg_settings_max_files_per_process{server=”192.168.2.81:5678”} 1000
#HELP pg_settings_max_function_args Shows the maximum number of function arguments. #TYPE pg_settings_max_function_args gauge pg_settings_max_function_args{server=”192.168.2.81:5678”} 100
#HELP pg_settings_max_identifier_length Shows the maximum identifier length. #TYPE pg_settings_max_identifier_length gauge pg_settings_max_identifier_length{server=”192.168.2.81:5678”} 63
#HELP pg_settings_max_index_keys Shows the maximum number of index keys. #TYPE pg_settings_max_index_keys gauge pg_settings_max_index_keys{server=”192.168.2.81:5678”} 32
#HELP pg_settings_max_locks_per_transaction Sets the maximum number of locks per transaction. #TYPE pg_settings_max_locks_per_transaction gauge pg_settings_max_locks_per_transaction{server=”192.168.2.81:5678”} 64
#HELP pg_settings_max_logical_replication_workers Maximum number of logical replication worker processes. #TYPE pg_settings_max_logical_replication_workers gauge pg_settings_max_logical_replication_workers{server=”192.168.2.81:5678”} 4
#HELP pg_settings_max_parallel_maintenance_workers Sets the maximum number of parallel processes per maintenance operation. #TYPE pg_settings_max_parallel_maintenance_workers gauge pg_settings_max_parallel_maintenance_workers{server=”192.168.2.81:5678”} 2
#HELP pg_settings_max_parallel_workers Sets the maximum number of parallel workers that can be active at one time. #TYPE pg_settings_max_parallel_workers gauge pg_settings_max_parallel_workers{server=”192.168.2.81:5678”} 8
#HELP pg_settings_max_parallel_workers_per_gather Sets the maximum number of parallel processes per executor node. #TYPE pg_settings_max_parallel_workers_per_gather gauge pg_settings_max_parallel_workers_per_gather{server=”192.168.2.81:5678”} 2
#HELP pg_settings_max_pred_locks_per_page Sets the maximum number of predicate-locked tuples per page. #TYPE pg_settings_max_pred_locks_per_page gauge pg_settings_max_pred_locks_per_page{server=”192.168.2.81:5678”} 2
#HELP pg_settings_max_pred_locks_per_relation Sets the maximum number of predicate-locked pages and tuples per relation. #TYPE pg_settings_max_pred_locks_per_relation gauge pg_settings_max_pred_locks_per_relation{server=”192.168.2.81:5678”} -2
#HELP pg_settings_max_pred_locks_per_transaction Sets the maximum number of predicate locks per transaction. #TYPE pg_settings_max_pred_locks_per_transaction gauge pg_settings_max_pred_locks_per_transaction{server=”192.168.2.81:5678”} 64
#HELP pg_settings_max_prepared_transactions Sets the maximum number of simultaneously prepared transactions. #TYPE pg_settings_max_prepared_transactions gauge pg_settings_max_prepared_transactions{server=”192.168.2.81:5678”} 0
#HELP pg_settings_max_replication_slots Sets the maximum number of simultaneously defined replication slots. #TYPE pg_settings_max_replication_slots gauge pg_settings_max_replication_slots{server=”192.168.2.81:5678”} 10
#HELP pg_settings_max_slot_wal_keep_size_bytes Sets the maximum WAL size that can be reserved by replication slots. [Units converted to bytes.] #TYPE pg_settings_max_slot_wal_keep_size_bytes gauge pg_settings_max_slot_wal_keep_size_bytes{server=”192.168.2.81:5678”} -1
#HELP pg_settings_max_stack_depth_bytes Sets the maximum stack depth, in kilobytes. [Units converted to bytes.] #TYPE pg_settings_max_stack_depth_bytes gauge pg_settings_max_stack_depth_bytes{server=”192.168.2.81:5678”} 2.097152e+06
#HELP pg_settings_max_standby_archive_delay_seconds Sets the maximum delay before canceling queries when a hot standby server is processing archived WAL data. [Units converted to seconds.] #TYPE pg_settings_max_standby_archive_delay_seconds gauge pg_settings_max_standby_archive_delay_seconds{server=”192.168.2.81:5678”} 30
#HELP pg_settings_max_standby_streaming_delay_seconds Sets the maximum delay before canceling queries when a hot standby server is processing streamed WAL data. [Units converted to seconds.] #TYPE pg_settings_max_standby_streaming_delay_seconds gauge pg_settings_max_standby_streaming_delay_seconds{server=”192.168.2.81:5678”} 30
#HELP pg_settings_max_sync_workers_per_subscription Maximum number of table synchronization workers per subscription. #TYPE pg_settings_max_sync_workers_per_subscription gauge pg_settings_max_sync_workers_per_subscription{server=”192.168.2.81:5678”} 2
#HELP pg_settings_max_wal_senders Sets the maximum number of simultaneously running WAL sender processes. #TYPE pg_settings_max_wal_senders gauge pg_settings_max_wal_senders{server=”192.168.2.81:5678”} 10
#HELP pg_settings_max_wal_size_bytes Sets the WAL size that triggers a checkpoint. [Units converted to bytes.] #TYPE pg_settings_max_wal_size_bytes gauge pg_settings_max_wal_size_bytes{server=”192.168.2.81:5678”} 1.073741824e+09
#HELP pg_settings_max_worker_processes Maximum number of concurrent worker processes. #TYPE pg_settings_max_worker_processes gauge pg_settings_max_worker_processes{server=”192.168.2.81:5678”} 8
#HELP pg_settings_min_dynamic_shared_memory_bytes Amount of dynamic shared memory reserved at startup. [Units converted to bytes.] #TYPE pg_settings_min_dynamic_shared_memory_bytes gauge pg_settings_min_dynamic_shared_memory_bytes{server=”192.168.2.81:5678”} 0
#HELP pg_settings_min_parallel_index_scan_size_bytes Sets the minimum amount of index data for a parallel scan. [Units converted to bytes.] #TYPE pg_settings_min_parallel_index_scan_size_bytes gauge pg_settings_min_parallel_index_scan_size_bytes{server=”192.168.2.81:5678”} 524288
#HELP pg_settings_min_parallel_table_scan_size_bytes Sets the minimum amount of table data for a parallel scan. [Units converted to bytes.] #TYPE pg_settings_min_parallel_table_scan_size_bytes gauge pg_settings_min_parallel_table_scan_size_bytes{server=”192.168.2.81:5678”} 8.388608e+06
#HELP pg_settings_min_wal_size_bytes Sets the minimum size to shrink the WAL to. [Units converted to bytes.] #TYPE pg_settings_min_wal_size_bytes gauge pg_settings_min_wal_size_bytes{server=”192.168.2.81:5678”} 8.388608e+07
#HELP pg_settings_old_snapshot_threshold_seconds Time before a snapshot is too old to read pages changed after the snapshot was taken. [Units converted to seconds.] #TYPE pg_settings_old_snapshot_threshold_seconds gauge pg_settings_old_snapshot_threshold_seconds{server=”192.168.2.81:5678”} -1
#HELP pg_settings_parallel_leader_participation Controls whether Gather and Gather Merge also run subplans. #TYPE pg_settings_parallel_leader_participation gauge pg_settings_parallel_leader_participation{server=”192.168.2.81:5678”} 1
#HELP pg_settings_parallel_setup_cost Sets the planner’s estimate of the cost of starting up worker processes for parallel query. #TYPE pg_settings_parallel_setup_cost gauge pg_settings_parallel_setup_cost{server=”192.168.2.81:5678”} 1000
#HELP pg_settings_parallel_tuple_cost Sets the planner’s estimate of the cost of passing each tuple (row) from worker to leader backend. #TYPE pg_settings_parallel_tuple_cost gauge pg_settings_parallel_tuple_cost{server=”192.168.2.81:5678”} 0.1
#HELP pg_settings_pg_stat_statements_max Sets the maximum number of statements tracked by pg_stat_statements. #TYPE pg_settings_pg_stat_statements_max gauge pg_settings_pg_stat_statements_max{server=”192.168.2.81:5678”} 1000
#HELP pg_settings_pg_stat_statements_save Save pg_stat_statements statistics across server shutdowns. #TYPE pg_settings_pg_stat_statements_save gauge pg_settings_pg_stat_statements_save{server=”192.168.2.81:5678”} 1
#HELP pg_settings_pg_stat_statements_track_planning Selects whether planning duration is tracked by pg_stat_statements. #TYPE pg_settings_pg_stat_statements_track_planning gauge pg_settings_pg_stat_statements_track_planning{server=”192.168.2.81:5678”} 0
#HELP pg_settings_pg_stat_statements_track_utility Selects whether utility commands are tracked by pg_stat_statements. #TYPE pg_settings_pg_stat_statements_track_utility gauge pg_settings_pg_stat_statements_track_utility{server=”192.168.2.81:5678”} 1
#HELP pg_settings_port Sets the TCP port the server listens on. #TYPE pg_settings_port gauge pg_settings_port{server=”192.168.2.81:5678”} 5678
#HELP pg_settings_post_auth_delay_seconds Waits N seconds on connection startup after authentication. [Units converted to seconds.] #TYPE pg_settings_post_auth_delay_seconds gauge pg_settings_post_auth_delay_seconds{server=”192.168.2.81:5678”} 0
#HELP pg_settings_pre_auth_delay_seconds Waits N seconds on connection startup before authentication. [Units converted to seconds.] #TYPE pg_settings_pre_auth_delay_seconds gauge pg_settings_pre_auth_delay_seconds{server=”192.168.2.81:5678”} 0
#HELP pg_settings_quote_all_identifiers When generating SQL fragments, quote all identifiers. #TYPE pg_settings_quote_all_identifiers gauge pg_settings_quote_all_identifiers{server=”192.168.2.81:5678”} 0
#HELP pg_settings_random_page_cost Sets the planner’s estimate of the cost of a nonsequentially fetched disk page. #TYPE pg_settings_random_page_cost gauge pg_settings_random_page_cost{server=”192.168.2.81:5678”} 4
#HELP pg_settings_recovery_min_apply_delay_seconds Sets the minimum delay for applying changes during recovery. [Units converted to seconds.] #TYPE pg_settings_recovery_min_apply_delay_seconds gauge pg_settings_recovery_min_apply_delay_seconds{server=”192.168.2.81:5678”} 0
#HELP pg_settings_recovery_target_inclusive Sets whether to include or exclude transaction with recovery target. #TYPE pg_settings_recovery_target_inclusive gauge pg_settings_recovery_target_inclusive{server=”192.168.2.81:5678”} 1
#HELP pg_settings_remove_temp_files_after_crash Remove temporary files after backend crash. #TYPE pg_settings_remove_temp_files_after_crash gauge pg_settings_remove_temp_files_after_crash{server=”192.168.2.81:5678”} 1
#HELP pg_settings_restart_after_crash Reinitialize server after backend crash. #TYPE pg_settings_restart_after_crash gauge pg_settings_restart_after_crash{server=”192.168.2.81:5678”} 1
#HELP pg_settings_row_security Enable row security. #TYPE pg_settings_row_security gauge pg_settings_row_security{server=”192.168.2.81:5678”} 1
#HELP pg_settings_segment_size_bytes Shows the number of pages per disk file. [Units converted to bytes.] #TYPE pg_settings_segment_size_bytes gauge pg_settings_segment_size_bytes{server=”192.168.2.81:5678”} 1.073741824e+09
#HELP pg_settings_seq_page_cost Sets the planner’s estimate of the cost of a sequentially fetched disk page. #TYPE pg_settings_seq_page_cost gauge pg_settings_seq_page_cost{server=”192.168.2.81:5678”} 1
#HELP pg_settings_server_version_num Shows the server version as an integer. #TYPE pg_settings_server_version_num gauge pg_settings_server_version_num{server=”192.168.2.81:5678”} 220004
#HELP pg_settings_shared_buffers_bytes Sets the number of shared memory buffers used by the server. [Units converted to bytes.] #TYPE pg_settings_shared_buffers_bytes gauge pg_settings_shared_buffers_bytes{server=”192.168.2.81:5678”} 1.34217728e+08
#HELP pg_settings_ssl Enables SSL connections. #TYPE pg_settings_ssl gauge pg_settings_ssl{server=”192.168.2.81:5678”} 0
#HELP pg_settings_ssl_passphrase_command_supports_reload Also use ssl_passphrase_command during server reload. #TYPE pg_settings_ssl_passphrase_command_supports_reload gauge pg_settings_ssl_passphrase_command_supports_reload{server=”192.168.2.81:5678”} 0
#HELP pg_settings_ssl_prefer_server_ciphers Give priority to server ciphersuite order. #TYPE pg_settings_ssl_prefer_server_ciphers gauge pg_settings_ssl_prefer_server_ciphers{server=”192.168.2.81:5678”} 1
#HELP pg_settings_standard_conforming_strings Causes ‘…’ strings to treat backslashes literally. #TYPE pg_settings_standard_conforming_strings gauge pg_settings_standard_conforming_strings{server=”192.168.2.81:5678”} 1
#HELP pg_settings_statement_timeout_seconds Sets the maximum allowed duration of any statement. [Units converted to seconds.] #TYPE pg_settings_statement_timeout_seconds gauge pg_settings_statement_timeout_seconds{server=”192.168.2.81:5678”} 0
#HELP pg_settings_superuser_reserved_connections Sets the number of connection slots reserved for superusers. #TYPE pg_settings_superuser_reserved_connections gauge pg_settings_superuser_reserved_connections{server=”192.168.2.81:5678”} 3
#HELP pg_settings_synchronize_seqscans Enable synchronized sequential scans. #TYPE pg_settings_synchronize_seqscans gauge pg_settings_synchronize_seqscans{server=”192.168.2.81:5678”} 1
#HELP pg_settings_syslog_sequence_numbers Add sequence number to syslog messages to avoid duplicate suppression. #TYPE pg_settings_syslog_sequence_numbers gauge pg_settings_syslog_sequence_numbers{server=”192.168.2.81:5678”} 1
#HELP pg_settings_syslog_split_messages Split messages sent to syslog by lines and to fit into 1024 bytes. #TYPE pg_settings_syslog_split_messages gauge pg_settings_syslog_split_messages{server=”192.168.2.81:5678”} 1
#HELP pg_settings_tcp_keepalives_count Maximum number of TCP keepalive retransmits. #TYPE pg_settings_tcp_keepalives_count gauge pg_settings_tcp_keepalives_count{server=”192.168.2.81:5678”} 9
#HELP pg_settings_tcp_keepalives_idle_seconds Time between issuing TCP keepalives. [Units converted to seconds.] #TYPE pg_settings_tcp_keepalives_idle_seconds gauge pg_settings_tcp_keepalives_idle_seconds{server=”192.168.2.81:5678”} 7200
#HELP pg_settings_tcp_keepalives_interval_seconds Time between TCP keepalive retransmits. [Units converted to seconds.] #TYPE pg_settings_tcp_keepalives_interval_seconds gauge pg_settings_tcp_keepalives_interval_seconds{server=”192.168.2.81:5678”} 75
#HELP pg_settings_tcp_user_timeout_seconds TCP user timeout. [Units converted to seconds.] #TYPE pg_settings_tcp_user_timeout_seconds gauge pg_settings_tcp_user_timeout_seconds{server=”192.168.2.81:5678”} 0
#HELP pg_settings_temp_buffers_bytes Sets the maximum number of temporary buffers used by each session. [Units converted to bytes.] #TYPE pg_settings_temp_buffers_bytes gauge pg_settings_temp_buffers_bytes{server=”192.168.2.81:5678”} 8.388608e+06
#HELP pg_settings_temp_file_limit_bytes Limits the total size of all temporary files used by each process. [Units converted to bytes.] #TYPE pg_settings_temp_file_limit_bytes gauge pg_settings_temp_file_limit_bytes{server=”192.168.2.81:5678”} -1
#HELP pg_settings_trace_notify Generates debugging output for LISTEN and NOTIFY. #TYPE pg_settings_trace_notify gauge pg_settings_trace_notify{server=”192.168.2.81:5678”} 0
#HELP pg_settings_trace_sort Emit information about resource usage in sorting. #TYPE pg_settings_trace_sort gauge pg_settings_trace_sort{server=”192.168.2.81:5678”} 0
#HELP pg_settings_track_activities Collects information about executing commands. #TYPE pg_settings_track_activities gauge pg_settings_track_activities{server=”192.168.2.81:5678”} 1
#HELP pg_settings_track_activity_query_size_bytes Sets the size reserved for pg_stat_activity.query, in bytes. [Units converted to bytes.] #TYPE pg_settings_track_activity_query_size_bytes gauge pg_settings_track_activity_query_size_bytes{server=”192.168.2.81:5678”} 1024
#HELP pg_settings_track_commit_timestamp Collects transaction commit time. #TYPE pg_settings_track_commit_timestamp gauge pg_settings_track_commit_timestamp{server=”192.168.2.81:5678”} 0
#HELP pg_settings_track_counts Collects statistics on database activity. #TYPE pg_settings_track_counts gauge pg_settings_track_counts{server=”192.168.2.81:5678”} 1
#HELP pg_settings_track_io_timing Collects timing statistics for database I/O activity. #TYPE pg_settings_track_io_timing gauge pg_settings_track_io_timing{server=”192.168.2.81:5678”} 0
#HELP pg_settings_track_wal_io_timing Collects timing statistics for WAL I/O activity. #TYPE pg_settings_track_wal_io_timing gauge pg_settings_track_wal_io_timing{server=”192.168.2.81:5678”} 0
#HELP pg_settings_transaction_deferrable Whether to defer a read-only serializable transaction until it can be executed with no possible serialization failures. #TYPE pg_settings_transaction_deferrable gauge pg_settings_transaction_deferrable{server=”192.168.2.81:5678”} 0
#HELP pg_settings_transaction_read_only Sets the current transaction’s read-only status. #TYPE pg_settings_transaction_read_only gauge pg_settings_transaction_read_only{server=”192.168.2.81:5678”} 0
#HELP pg_settings_transform_null_equals Treats “expr=NULL” as “expr IS NULL”. #TYPE pg_settings_transform_null_equals gauge pg_settings_transform_null_equals{server=”192.168.2.81:5678”} 0
#HELP pg_settings_unix_socket_permissions Sets the access permissions of the Unix-domain socket. #TYPE pg_settings_unix_socket_permissions gauge pg_settings_unix_socket_permissions{server=”192.168.2.81:5678”} 777
#HELP pg_settings_update_process_title Updates the process title to show the active SQL command. #TYPE pg_settings_update_process_title gauge pg_settings_update_process_title{server=”192.168.2.81:5678”} 1
#HELP pg_settings_vacuum_cost_delay_seconds Vacuum cost delay in milliseconds. [Units converted to seconds.] #TYPE pg_settings_vacuum_cost_delay_seconds gauge pg_settings_vacuum_cost_delay_seconds{server=”192.168.2.81:5678”} 0
#HELP pg_settings_vacuum_cost_limit Vacuum cost amount available before napping. #TYPE pg_settings_vacuum_cost_limit gauge pg_settings_vacuum_cost_limit{server=”192.168.2.81:5678”} 200
#HELP pg_settings_vacuum_cost_page_dirty Vacuum cost for a page dirtied by vacuum. #TYPE pg_settings_vacuum_cost_page_dirty gauge pg_settings_vacuum_cost_page_dirty{server=”192.168.2.81:5678”} 20
#HELP pg_settings_vacuum_cost_page_hit Vacuum cost for a page found in the buffer cache. #TYPE pg_settings_vacuum_cost_page_hit gauge pg_settings_vacuum_cost_page_hit{server=”192.168.2.81:5678”} 1
#HELP pg_settings_vacuum_cost_page_miss Vacuum cost for a page not found in the buffer cache. #TYPE pg_settings_vacuum_cost_page_miss gauge pg_settings_vacuum_cost_page_miss{server=”192.168.2.81:5678”} 2
#HELP pg_settings_vacuum_defer_cleanup_age Number of transactions by which VACUUM and HOT cleanup should be deferred, if any. #TYPE pg_settings_vacuum_defer_cleanup_age gauge pg_settings_vacuum_defer_cleanup_age{server=”192.168.2.81:5678”} 0
#HELP pg_settings_vacuum_failsafe_age Age at which VACUUM should trigger failsafe to avoid a wraparound outage. #TYPE pg_settings_vacuum_failsafe_age gauge pg_settings_vacuum_failsafe_age{server=”192.168.2.81:5678”} 1.6e+09
#HELP pg_settings_vacuum_freeze_min_age Minimum age at which VACUUM should freeze a table row. #TYPE pg_settings_vacuum_freeze_min_age gauge pg_settings_vacuum_freeze_min_age{server=”192.168.2.81:5678”} 5e+07
#HELP pg_settings_vacuum_freeze_table_age Age at which VACUUM should scan whole table to freeze tuples. #TYPE pg_settings_vacuum_freeze_table_age gauge pg_settings_vacuum_freeze_table_age{server=”192.168.2.81:5678”} 1.5e+08
#HELP pg_settings_vacuum_multixact_failsafe_age Multixact age at which VACUUM should trigger failsafe to avoid a wraparound outage. #TYPE pg_settings_vacuum_multixact_failsafe_age gauge pg_settings_vacuum_multixact_failsafe_age{server=”192.168.2.81:5678”} 1.6e+09
#HELP pg_settings_vacuum_multixact_freeze_min_age Minimum age at which VACUUM should freeze a MultiXactId in a table row. #TYPE pg_settings_vacuum_multixact_freeze_min_age gauge pg_settings_vacuum_multixact_freeze_min_age{server=”192.168.2.81:5678”} 5e+06
#HELP pg_settings_vacuum_multixact_freeze_table_age Multixact age at which VACUUM should scan whole table to freeze tuples. #TYPE pg_settings_vacuum_multixact_freeze_table_age gauge pg_settings_vacuum_multixact_freeze_table_age{server=”192.168.2.81:5678”} 1.5e+08
#HELP pg_settings_wal_block_size Shows the block size in the write ahead log. #TYPE pg_settings_wal_block_size gauge pg_settings_wal_block_size{server=”192.168.2.81:5678”} 8192
#HELP pg_settings_wal_buffers_bytes Sets the number of disk-page buffers in shared memory for WAL. [Units converted to bytes.] #TYPE pg_settings_wal_buffers_bytes gauge pg_settings_wal_buffers_bytes{server=”192.168.2.81:5678”} 4.194304e+06
#HELP pg_settings_wal_compression Compresses full-page writes written in WAL file. #TYPE pg_settings_wal_compression gauge pg_settings_wal_compression{server=”192.168.2.81:5678”} 0
#HELP pg_settings_wal_init_zero Writes zeroes to new WAL files before first use. #TYPE pg_settings_wal_init_zero gauge pg_settings_wal_init_zero{server=”192.168.2.81:5678”} 1
#HELP pg_settings_wal_keep_size_bytes Sets the size of WAL files held for standby servers. [Units converted to bytes.] #TYPE pg_settings_wal_keep_size_bytes gauge pg_settings_wal_keep_size_bytes{server=”192.168.2.81:5678”} 3.3554432e+07
#HELP pg_settings_wal_log_hints Writes full pages to WAL when first modified after a checkpoint, even for a non-critical modification. #TYPE pg_settings_wal_log_hints gauge pg_settings_wal_log_hints{server=”192.168.2.81:5678”} 1
#HELP pg_settings_wal_receiver_create_temp_slot Sets whether a WAL receiver should create a temporary replication slot if no permanent slot is configured. #TYPE pg_settings_wal_receiver_create_temp_slot gauge pg_settings_wal_receiver_create_temp_slot{server=”192.168.2.81:5678”} 0
#HELP pg_settings_wal_receiver_status_interval_seconds Sets the maximum interval between WAL receiver status reports to the sending server. [Units converted to seconds.] #TYPE pg_settings_wal_receiver_status_interval_seconds gauge pg_settings_wal_receiver_status_interval_seconds{server=”192.168.2.81:5678”} 10
#HELP pg_settings_wal_receiver_timeout_seconds Sets the maximum wait time to receive data from the sending server. [Units converted to seconds.] #TYPE pg_settings_wal_receiver_timeout_seconds gauge pg_settings_wal_receiver_timeout_seconds{server=”192.168.2.81:5678”} 60
#HELP pg_settings_wal_recycle Recycles WAL files by renaming them. #TYPE pg_settings_wal_recycle gauge pg_settings_wal_recycle{server=”192.168.2.81:5678”} 1
#HELP pg_settings_wal_retrieve_retry_interval_seconds Sets the time to wait before retrying to retrieve WAL after a failed attempt. [Units converted to seconds.] #TYPE pg_settings_wal_retrieve_retry_interval_seconds gauge pg_settings_wal_retrieve_retry_interval_seconds{server=”192.168.2.81:5678”} 5
#HELP pg_settings_wal_segment_size_bytes Shows the size of write ahead log segments. [Units converted to bytes.] #TYPE pg_settings_wal_segment_size_bytes gauge pg_settings_wal_segment_size_bytes{server=”192.168.2.81:5678”} 1.6777216e+07
#HELP pg_settings_wal_sender_timeout_seconds Sets the maximum time to wait for WAL replication. [Units converted to seconds.] #TYPE pg_settings_wal_sender_timeout_seconds gauge pg_settings_wal_sender_timeout_seconds{server=”192.168.2.81:5678”} 60
#HELP pg_settings_wal_skip_threshold_bytes Minimum size of new file to fsync instead of writing WAL. [Units converted to bytes.] #TYPE pg_settings_wal_skip_threshold_bytes gauge pg_settings_wal_skip_threshold_bytes{server=”192.168.2.81:5678”} 2.097152e+06
#HELP pg_settings_wal_writer_delay_seconds Time between WAL flushes performed in the WAL writer. [Units converted to seconds.] #TYPE pg_settings_wal_writer_delay_seconds gauge pg_settings_wal_writer_delay_seconds{server=”192.168.2.81:5678”} 0.2
#HELP pg_settings_wal_writer_flush_after_bytes Amount of WAL written out by WAL writer that triggers a flush. [Units converted to bytes.] #TYPE pg_settings_wal_writer_flush_after_bytes gauge pg_settings_wal_writer_flush_after_bytes{server=”192.168.2.81:5678”} 1.048576e+06
#HELP pg_settings_work_mem_bytes Sets the maximum memory to be used for query workspaces. [Units converted to bytes.] #TYPE pg_settings_work_mem_bytes gauge pg_settings_work_mem_bytes{server=”192.168.2.81:5678”} 4.194304e+06
#HELP pg_settings_zero_damaged_pages Continues processing past damaged page headers. #TYPE pg_settings_zero_damaged_pages gauge pg_settings_zero_damaged_pages{server=”192.168.2.81:5678”} 0
#HELP pg_stat_activity_count number of connections in this state #TYPE pg_stat_activity_count gauge #活动连接数 pg_stat_activity_count{datname=”unvdb”,server=”192.168.2.81:5678”,state=”active”} 1 pg_stat_activity_count{datname=”unvdb”,server=”192.168.2.81:5678”,state=”disabled”} 0 pg_stat_activity_count{datname=”unvdb”,server=”192.168.2.81:5678”,state=”fastpath function call”} 0 pg_stat_activity_count{datname=”unvdb”,server=”192.168.2.81:5678”,state=”idle”} 3 pg_stat_activity_count{datname=”unvdb”,server=”192.168.2.81:5678”,state=”idle in transaction”} 0 pg_stat_activity_count{datname=”unvdb”,server=”192.168.2.81:5678”,state=”idle in transaction (aborted)”} 0
#HELP pg_stat_activity_max_tx_duration max duration in seconds any active transaction has been running #TYPE pg_stat_activity_max_tx_duration gauge #最长事务执行时间 pg_stat_activity_max_tx_duration{datname=”unvdb”,server=”192.168.2.81:5678”,state=”active”} 0 pg_stat_activity_max_tx_duration{datname=”unvdb”,server=”192.168.2.81:5678”,state=”disabled”} 0 pg_stat_activity_max_tx_duration{datname=”unvdb”,server=”192.168.2.81:5678”,state=”fastpath function call”} 0 pg_stat_activity_max_tx_duration{datname=”unvdb”,server=”192.168.2.81:5678”,state=”idle”} 0 pg_stat_activity_max_tx_duration{datname=”unvdb”,server=”192.168.2.81:5678”,state=”idle in transaction”} 0 pg_stat_activity_max_tx_duration{datname=”unvdb”,server=”192.168.2.81:5678”,state=”idle in transaction (aborted)”} 0
#HELP pg_stat_archiver_archived_count Number of WAL files that have been successfully archived #TYPE pg_stat_archiver_archived_count counter #归档次数 pg_stat_archiver_archived_count{server=”192.168.2.81:5678”} 1
#HELP pg_stat_archiver_failed_count Number of failed attempts for archiving WAL files #TYPE pg_stat_archiver_failed_count counter #归档失败次数 pg_stat_archiver_failed_count{server=”192.168.2.81:5678”} 0
#HELP pg_stat_archiver_last_archive_age Time in seconds since last WAL segment was successfully archived #TYPE pg_stat_archiver_last_archive_age gauge #上次归档距离现在的时间 pg_stat_archiver_last_archive_age{server=”192.168.2.81:5678”} 2358.904581
#HELP pg_stat_bgwriter_buffers_alloc_total Number of buffers allocated #TYPE pg_stat_bgwriter_buffers_alloc_total counter #分配的缓冲区数数量 pg_stat_bgwriter_buffers_alloc_total{server=”192.168.2.81:5678”} 960
#HELP pg_stat_bgwriter_buffers_backend_fsync_total Number of times a backend had to execute its own fsync call (normally the background writer handles those even when the backend does its own write) #TYPE pg_stat_bgwriter_buffers_backend_fsync_total counter #fsync 调用的次数 pg_stat_bgwriter_buffers_backend_fsync_total{server=”192.168.2.81:5678”} 0
#HELP pg_stat_bgwriter_buffers_backend_total Number of buffers written directly by a backend #TYPE pg_stat_bgwriter_buffers_backend_total counter #后端直接写入的缓冲区数 pg_stat_bgwriter_buffers_backend_total{server=”192.168.2.81:5678”} 0
#HELP pg_stat_bgwriter_buffers_checkpoint_total Number of buffers written during checkpoints #TYPE pg_stat_bgwriter_buffers_checkpoint_total counter #检查点期间写入的缓冲区数 pg_stat_bgwriter_buffers_checkpoint_total{server=”192.168.2.81:5678”} 0
#HELP pg_stat_bgwriter_buffers_clean_total Number of buffers written by the background writer #TYPE pg_stat_bgwriter_buffers_clean_total counter #后台写入器写入的缓冲区数 pg_stat_bgwriter_buffers_clean_total{server=”192.168.2.81:5678”} 0
#HELP pg_stat_bgwriter_checkpoint_sync_time_total Total amount of time that has been spent in the portion of checkpoint processing where files are synchronized to disk, in milliseconds #TYPE pg_stat_bgwriter_checkpoint_sync_time_total counter #在文件同步到磁盘的检查点处理部分中花费的总时间,以毫秒为单位 pg_stat_bgwriter_checkpoint_sync_time_total{server=”192.168.2.81:5678”} 0
#HELP pg_stat_bgwriter_checkpoint_write_time_total Total amount of time that has been spent in the portion of checkpoint processing where files are written to disk, in milliseconds #TYPE pg_stat_bgwriter_checkpoint_write_time_total counter #在将文件写入磁盘的检查点处理部分中花费的总时间,以毫秒为单位 pg_stat_bgwriter_checkpoint_write_time_total{server=”192.168.2.81:5678”} 0
#HELP pg_stat_bgwriter_checkpoints_req_total Number of requested checkpoints that have been performed #TYPE pg_stat_bgwriter_checkpoints_req_total counter #已执行的请求检查点数 pg_stat_bgwriter_checkpoints_req_total{server=”192.168.2.81:5678”} 0
#HELP pg_stat_bgwriter_checkpoints_timed_total Number of scheduled checkpoints that have been performed #TYPE pg_stat_bgwriter_checkpoints_timed_total counter #已执行的计划检查点数 pg_stat_bgwriter_checkpoints_timed_total{server=”192.168.2.81:5678”} 8
#HELP pg_stat_bgwriter_maxwritten_clean_total Number of times the background writer stopped a cleaning scan because it had written too many buffers #TYPE pg_stat_bgwriter_maxwritten_clean_total counter #后台写入程序因写入太多缓冲区而停止清理扫描的次数 pg_stat_bgwriter_maxwritten_clean_total{server=”192.168.2.81:5678”} 0
#HELP pg_stat_bgwriter_stats_reset_total Time at which these statistics were last reset #TYPE pg_stat_bgwriter_stats_reset_total counter #上次重置这些统计信息的时间 pg_stat_bgwriter_stats_reset_total{server=”192.168.2.81:5678”} 1.66694277e+09
#HELP pg_stat_database_active_time Unknown metric from pg_stat_database #TYPE pg_stat_database_active_time untyped # pg_stat_database_active_time{datid=”13892”,datname=”unvdb”,server=”192.168.2.81:5678”} 2223.186 pg_stat_database_active_time{datid=”16466”,datname=”test”,server=”192.168.2.81:5678”} 515.522
#HELP pg_stat_database_blk_read_time Time spent reading data file blocks by backends in this database, in milliseconds #TYPE pg_stat_database_blk_read_time counter #此数据库中后端读取数据文件块所花费的时间,以毫秒为单位 pg_stat_database_blk_read_time{datid=”1”,datname=”template1”,server=”192.168.2.81:5678”} 0 pg_stat_database_blk_read_time{datid=”13891”,datname=”template0”,server=”192.168.2.81:5678”} 0 pg_stat_database_blk_read_time{datid=”13892”,datname=”unvdb”,server=”192.168.2.81:5678”} 0
#HELP pg_stat_database_blk_write_time Time spent writing data file blocks by backends in this database, in milliseconds #TYPE pg_stat_database_blk_write_time counter #后端在此数据库中写入数据文件块所花费的时间,以毫秒为单位 pg_stat_database_blk_write_time{datid=”1”,datname=”template1”,server=”192.168.2.81:5678”} 0 pg_stat_database_blk_write_time{datid=”13891”,datname=”template0”,server=”192.168.2.81:5678”} 0 pg_stat_database_blk_write_time{datid=”13892”,datname=”unvdb”,server=”192.168.2.81:5678”} 0
#HELP pg_stat_database_blks_hit Number of times disk blocks were found already in the buffer cache, so that a read was not necessary (this only includes hits in the PostgreSQL buffer cache, not the operating system’s file system cache) #TYPE pg_stat_database_blks_hit counter #已经在缓冲区缓存中找到磁盘块的次数,因此不需要读取(这仅包括 UDB 缓冲区缓存中的命中) pg_stat_database_blks_hit{datid=”13892”,datname=”unvdb”,server=”192.168.2.81:5678”} 13186
#HELP pg_stat_database_blks_read Number of disk blocks read in this database #TYPE pg_stat_database_blks_read counter #此数据库中读取的磁盘块数 pg_stat_database_blks_read{datid=”13892”,datname=”unvdb”,server=”192.168.2.81:5678”} 257
#HELP pg_stat_database_checksum_failures Unknown metric from pg_stat_database #TYPE pg_stat_database_checksum_failures untyped pg_stat_database_checksum_failures{datid=”13892”,datname=”unvdb”,server=”192.168.2.81:5678”} NaN
#HELP pg_stat_database_checksum_last_failure Unknown metric from pg_stat_database #TYPE pg_stat_database_checksum_last_failure untyped pg_stat_database_checksum_last_failure{datid=”13892”,datname=”unvdb”,server=”192.168.2.81:5678”} NaN
#HELP pg_stat_database_conflicts Number of queries canceled due to conflicts with recovery in this database. (Conflicts occur only on standby servers; see pg_stat_database_conflicts for details.) #TYPE pg_stat_database_conflicts counter #由于与此数据库中的恢复冲突而取消的查询数。(冲突仅发生在备用服务器上;有关详细信息,请参阅 pg_stat_database_conflicts。) pg_stat_database_conflicts{datid=”13892”,datname=”unvdb”,server=”192.168.2.81:5678”} 0
#HELP pg_stat_database_conflicts_confl_bufferpin Number of queries in this database that have been canceled due to pinned buffers #TYPE pg_stat_database_conflicts_confl_bufferpin counter #此数据库中由于固定缓冲区而取消的查询数 pg_stat_database_conflicts_confl_bufferpin{datid=”13892”,datname=”unvdb”,server=”192.168.2.81:5678”} 0
#HELP pg_stat_database_conflicts_confl_deadlock Number of queries in this database that have been canceled due to deadlocks #TYPE pg_stat_database_conflicts_confl_deadlock counter #此数据库中因死锁而取消的查询数 pg_stat_database_conflicts_confl_deadlock{datid=”13892”,datname=”unvdb”,server=”192.168.2.81:5678”} 0
#HELP pg_stat_database_conflicts_confl_lock Number of queries in this database that have been canceled due to lock timeouts #TYPE pg_stat_database_conflicts_confl_lock counter #此数据库中因锁定超时而取消的查询数 pg_stat_database_conflicts_confl_lock{datid=”13892”,datname=”unvdb”,server=”192.168.2.81:5678”} 0
#HELP pg_stat_database_conflicts_confl_snapshot Number of queries in this database that have been canceled due to old snapshots #TYPE pg_stat_database_conflicts_confl_snapshot counter #此数据库中因旧快照而取消的查询数 pg_stat_database_conflicts_confl_snapshot{datid=”13892”,datname=”unvdb”,server=”192.168.2.81:5678”} 0
#HELP pg_stat_database_conflicts_confl_tablespace Number of queries in this database that have been canceled due to dropped tablespaces #TYPE pg_stat_database_conflicts_confl_tablespace counter #此数据库中因删除表空间而取消的查询数 pg_stat_database_conflicts_confl_tablespace{datid=”13892”,datname=”unvdb”,server=”192.168.2.81:5678”} 0
#HELP pg_stat_database_deadlocks Number of deadlocks detected in this database #TYPE pg_stat_database_deadlocks counter #在此数据库中检测到的死锁数 pg_stat_database_deadlocks{datid=”13892”,datname=”unvdb”,server=”192.168.2.81:5678”} 0
#HELP pg_stat_database_idle_in_transaction_time Unknown metric from pg_stat_database #TYPE pg_stat_database_idle_in_transaction_time untyped
pg_stat_database_idle_in_transaction_time{datid=”13892”,datname=”unvdb”,server=”192.168.2.81:5678”} 0
#HELP pg_stat_database_numbackends Number of backends currently connected to this database. This is the only column in this view that returns a value reflecting current state; all other columns return the accumulated values since the last reset. #TYPE pg_stat_database_numbackends gauge #当前连接到此数据库的后端数。这是此视图中唯一返回反映当前状态的值的列;所有其他列返回自上次重置以来的累积值。 pg_stat_database_numbackends{datid=”13892”,datname=”unvdb”,server=”192.168.2.81:5678”} 4
#HELP pg_stat_database_session_time Unknown metric from pg_stat_database #TYPE pg_stat_database_session_time untyped #数据库会话时间 pg_stat_database_session_time{datid=”13892”,datname=”unvdb”,server=”192.168.2.81:5678”} 9.534344924e+06
#HELP pg_stat_database_sessions Unknown metric from pg_stat_database #TYPE pg_stat_database_sessions untyped #数据库会话数量 pg_stat_database_sessions{datid=”13892”,datname=”unvdb”,server=”192.168.2.81:5678”} 4
#HELP pg_stat_database_sessions_abandoned Unknown metric from pg_stat_database #TYPE pg_stat_database_sessions_abandoned untyped # pg_stat_database_sessions_abandoned{datid=”13892”,datname=”unvdb”,server=”192.168.2.81:5678”} 0
#HELP pg_stat_database_sessions_fatal Unknown metric from pg_stat_database #TYPE pg_stat_database_sessions_fatal untyped # pg_stat_database_sessions_fatal{datid=”13892”,datname=”unvdb”,server=”192.168.2.81:5678”} 0
#HELP pg_stat_database_sessions_killed Unknown metric from pg_stat_database #TYPE pg_stat_database_sessions_killed untyped #杀死的会话数量 pg_stat_database_sessions_killed{datid=”13892”,datname=”unvdb”,server=”192.168.2.81:5678”} 0
#HELP pg_stat_database_stats_reset Time at which these statistics were last reset #TYPE pg_stat_database_stats_reset counter #上次重置这些统计信息的时间 pg_stat_database_stats_reset{datid=”13892”,datname=”unvdb”,server=”192.168.2.81:5678”} 1.666942774e+09
#HELP pg_stat_database_temp_bytes Total amount of data written to temporary files by queries in this database. All temporary files are counted, regardless of why the temporary file was created, and regardless of the log_temp_files setting. #TYPE pg_stat_database_temp_bytes counter #此数据库中的查询写入临时文件的数据总量。无论创建临时文件的原因和 log_temp_files 设置如何,都会计算所有临时文件。 pg_stat_database_temp_bytes{datid=”13892”,datname=”unvdb”,server=”192.168.2.81:5678”} 0
#HELP pg_stat_database_temp_files Number of temporary files created by queries in this database. All temporary files are counted, regardless of why the temporary file was created (e.g., sorting or hashing), and regardless of the log_temp_files setting. #TYPE pg_stat_database_temp_files counter #此数据库中的查询创建的临时文件数。无论创建临时文件的原因(例如,排序或散列)以及 log_temp_files 设置如何,都会计算所有临时文件。 pg_stat_database_temp_files{datid=”13892”,datname=”unvdb”,server=”192.168.2.81:5678”} 0
#HELP pg_stat_database_tup_deleted Number of rows deleted by queries in this database #TYPE pg_stat_database_tup_deleted counter #此数据库中的查询删除的行数 pg_stat_database_tup_deleted{datid=”13892”,datname=”unvdb”,server=”192.168.2.81:5678”} 0
#HELP pg_stat_database_tup_fetched Number of rows fetched by queries in this database #TYPE pg_stat_database_tup_fetched counter #此数据库中的查询获取的行数 pg_stat_database_tup_fetched{datid=”13892”,datname=”unvdb”,server=”192.168.2.81:5678”} 5092
#HELP pg_stat_database_tup_inserted Number of rows inserted by queries in this database #TYPE pg_stat_database_tup_inserted counter #此数据库中查询插入的行数 pg_stat_database_tup_inserted{datid=”13892”,datname=”unvdb”,server=”192.168.2.81:5678”} 0
#HELP pg_stat_database_tup_returned Number of rows returned by queries in this database #TYPE pg_stat_database_tup_returned counter #此数据库中查询返回的行数 pg_stat_database_tup_returned{datid=”13892”,datname=”unvdb”,server=”192.168.2.81:5678”} 111589
#HELP pg_stat_database_tup_updated Number of rows updated by queries in this database #TYPE pg_stat_database_tup_updated counter #此数据库中的查询更新的行数 pg_stat_database_tup_updated{datid=”13892”,datname=”unvdb”,server=”192.168.2.81:5678”} 0
#HELP pg_stat_database_xact_commit Number of transactions in this database that have been committed #TYPE pg_stat_database_xact_commit counter #此数据库中已提交的事务数 pg_stat_database_xact_commit{datid=”13892”,datname=”unvdb”,server=”192.168.2.81:5678”} 1526
#HELP pg_stat_database_xact_rollback Number of transactions in this database that have been rolled back #TYPE pg_stat_database_xact_rollback counter #此数据库中已回滚的事务数 pg_stat_database_xact_rollback{datid=”13892”,datname=”unvdb”,server=”192.168.2.81:5678”} 0
#HELP pg_stat_replication_pg_current_wal_lsn_bytes WAL position in bytes #TYPE pg_stat_replication_pg_current_wal_lsn_bytes gauge #从库复制的字节数 pg_stat_replication_pg_current_wal_lsn_bytes{application_name=”walreceiver”,client_addr=”192.168.2.82”,server=”192.168.2.81:5678”,slot_name=”31644”,state=”streaming”} 5.838471168e+09
#HELP pg_stat_replication_pg_wal_lsn_diff Lag in bytes between master and slave #TYPE pg_stat_replication_pg_wal_lsn_diff gauge #从库延迟字节数 pg_stat_replication_pg_wal_lsn_diff{application_name=”walreceiver”,client_addr=”192.168.2.82”,server=”192.168.2.81:5678”,slot_name=”31644”,state=”streaming”} 0
#HELP pg_stat_replication_reply_time Unknown metric from pg_stat_replication #TYPE pg_stat_replication_reply_time untyped #从库的时间 pg_stat_replication_reply_time{application_name=”walreceiver”,client_addr=”192.168.2.82”,server=”192.168.2.81:5678”,slot_name=”31644”,state=”streaming”} 1.668156576e+09
自定义指标
pg_stat_statements_*指标为自定义指标,来自pg_stat_statements 表的数据。
#HELP pg_stat_statements_blk_read_time_seconds Total time the statement spent reading blocks, in milliseconds (if track_io_timing is enabled, otherwise zero) #TYPE pg_stat_statements_blk_read_time_seconds counter pg_stat_statements_blk_read_time_seconds{datname=”unvdb”,queryid=”-1708726048587104477”,rolname=”monitor”,server=”192.168.2.81:5678”} 0 pg_stat_statements_blk_read_time_seconds{datname=”unvdb”,queryid=”-1708726048587104477”,rolname=”unvdb”,server=”192.168.2.81:5678”} 0
#HELP pg_stat_statements_blk_write_time_seconds Total time the statement spent writing blocks, in milliseconds (if track_io_timing is enabled, otherwise zero) #TYPE pg_stat_statements_blk_write_time_seconds counter pg_stat_statements_blk_write_time_seconds{datname=”unvdb”,queryid=”-1708726048587104477”,rolname=”monitor”,server=”192.168.2.81:5678”} 0 pg_stat_statements_blk_write_time_seconds{datname=”unvdb”,queryid=”-1708726048587104477”,rolname=”unvdb”,server=”192.168.2.81:5678”} 0 pg_stat_statements_blk_write_time_seconds{datname=”unvdb”,queryid=”-182263461300699970”,rolname=”monitor”,server=”192.168.2.81:5678”} 0
#HELP pg_stat_statements_calls Number of times executed #TYPE pg_stat_statements_calls counter pg_stat_statements_calls{datname=”unvdb”,queryid=”-1708726048587104477”,rolname=”monitor”,server=”192.168.2.81:5678”} 41 pg_stat_statements_calls{datname=”unvdb”,queryid=”-1708726048587104477”,rolname=”unvdb”,server=”192.168.2.81:5678”} 45 ……
#HELP pg_stat_statements_local_blks_dirtied Total number of local blocks dirtied by the statement #TYPE pg_stat_statements_local_blks_dirtied counter pg_stat_statements_local_blks_dirtied{datname=”unvdb”,queryid=”-1708726048587104477”,rolname=”monitor”,server=”192.168.2.81:5678”} 0 pg_stat_statements_local_blks_dirtied{datname=”unvdb”,queryid=”-1708726048587104477”,rolname=”unvdb”,server=”192.168.2.81:5678”} 0 ……
#HELP pg_stat_statements_local_blks_hit Total number of local block cache hits by the statement #TYPE pg_stat_statements_local_blks_hit counter pg_stat_statements_local_blks_hit{datname=”unvdb”,queryid=”-1708726048587104477”,rolname=”monitor”,server=”192.168.2.81:5678”} 0 pg_stat_statements_local_blks_hit{datname=”unvdb”,queryid=”-1708726048587104477”,rolname=”unvdb”,server=”192.168.2.81:5678”} 0 ……
#HELP pg_stat_statements_local_blks_read Total number of local blocks read by the statement #TYPE pg_stat_statements_local_blks_read counter pg_stat_statements_local_blks_read{datname=”unvdb”,queryid=”-1708726048587104477”,rolname=”monitor”,server=”192.168.2.81:5678”} 0 pg_stat_statements_local_blks_read{datname=”unvdb”,queryid=”-1708726048587104477”,rolname=”unvdb”,server=”192.168.2.81:5678”} 0 ……
#HELP pg_stat_statements_local_blks_written Total number of local blocks written by the statement #TYPE pg_stat_statements_local_blks_written counter pg_stat_statements_local_blks_written{datname=”unvdb”,queryid=”-1708726048587104477”,rolname=”monitor”,server=”192.168.2.81:5678”} 0 pg_stat_statements_local_blks_written{datname=”unvdb”,queryid=”-1708726048587104477”,rolname=”unvdb”,server=”192.168.2.81:5678”} 0 ……
#HELP pg_stat_statements_max_time_seconds Maximum time spent in the statement, in milliseconds #TYPE pg_stat_statements_max_time_seconds gauge pg_stat_statements_max_time_seconds{datname=”unvdb”,queryid=”-1708726048587104477”,rolname=”monitor”,server=”192.168.2.81:5678”} 8.9499e-05 pg_stat_statements_max_time_seconds{datname=”unvdb”,queryid=”-1708726048587104477”,rolname=”unvdb”,server=”192.168.2.81:5678”} 0.000149184 ……
#HELP pg_stat_statements_mean_time_seconds Mean time spent in the statement, in milliseconds #TYPE pg_stat_statements_mean_time_seconds gauge pg_stat_statements_mean_time_seconds{datname=”unvdb”,queryid=”-1708726048587104477”,rolname=”monitor”,server=”192.168.2.81:5678”} 3.260673170731707e-05 pg_stat_statements_mean_time_seconds{datname=”unvdb”,queryid=”-1708726048587104477”,rolname=”unvdb”,server=”192.168.2.81:5678”} 3.779231111111114e-05 ……
#HELP pg_stat_statements_min_time_seconds Minimum time spent in the statement, in milliseconds #TYPE pg_stat_statements_min_time_seconds gauge pg_stat_statements_min_time_seconds{datname=”unvdb”,queryid=”-1708726048587104477”,rolname=”monitor”,server=”192.168.2.81:5678”} 7.2e-06 pg_stat_statements_min_time_seconds{datname=”unvdb”,queryid=”-1708726048587104477”,rolname=”unvdb”,server=”192.168.2.81:5678”} 5.6e-06 ……
#HELP pg_stat_statements_rows Total number of rows retrieved or affected by the statement #TYPE pg_stat_statements_rows counter pg_stat_statements_rows{datname=”unvdb”,queryid=”-1708726048587104477”,rolname=”monitor”,server=”192.168.2.81:5678”} 164 pg_stat_statements_rows{datname=”unvdb”,queryid=”-1708726048587104477”,rolname=”unvdb”,server=”192.168.2.81:5678”} 180 ……
#HELP pg_stat_statements_shared_blks_dirtied Total number of shared blocks dirtied by the statement #TYPE pg_stat_statements_shared_blks_dirtied counter pg_stat_statements_shared_blks_dirtied{datname=”unvdb”,queryid=”-1708726048587104477”,rolname=”monitor”,server=”192.168.2.81:5678”} 0 pg_stat_statements_shared_blks_dirtied{datname=”unvdb”,queryid=”-1708726048587104477”,rolname=”unvdb”,server=”192.168.2.81:5678”} 0 ……
#HELP pg_stat_statements_shared_blks_hit Total number of shared block cache hits by the statement #TYPE pg_stat_statements_shared_blks_hit counter pg_stat_statements_shared_blks_hit{datname=”unvdb”,queryid=”-1708726048587104477”,rolname=”monitor”,server=”192.168.2.81:5678”} 41 pg_stat_statements_shared_blks_hit{datname=”unvdb”,queryid=”-1708726048587104477”,rolname=”unvdb”,server=”192.168.2.81:5678”} 45 ……
#HELP pg_stat_statements_shared_blks_read Total number of shared blocks read by the statement #TYPE pg_stat_statements_shared_blks_read counter pg_stat_statements_shared_blks_read{datname=”unvdb”,queryid=”-1708726048587104477”,rolname=”monitor”,server=”192.168.2.81:5678”} 0 pg_stat_statements_shared_blks_read{datname=”unvdb”,queryid=”-1708726048587104477”,rolname=”unvdb”,server=”192.168.2.81:5678”} 0 ……
#HELP pg_stat_statements_shared_blks_written Total number of shared blocks written by the statement #TYPE pg_stat_statements_shared_blks_written counter pg_stat_statements_shared_blks_written{datname=”unvdb”,queryid=”-1708726048587104477”,rolname=”monitor”,server=”192.168.2.81:5678”} 0 pg_stat_statements_shared_blks_written{datname=”unvdb”,queryid=”-1708726048587104477”,rolname=”unvdb”,server=”192.168.2.81:5678”} 0 ……
#HELP pg_stat_statements_stddev_time_seconds Population standard deviation of time spent in the statement, in milliseconds #TYPE pg_stat_statements_stddev_time_seconds gauge pg_stat_statements_stddev_time_seconds{datname=”unvdb”,queryid=”-1708726048587104477”,rolname=”monitor”,server=”192.168.2.81:5678”} 1.9870226416798787e-05 pg_stat_statements_stddev_time_seconds{datname=”unvdb”,queryid=”-1708726048587104477”,rolname=”unvdb”,server=”192.168.2.81:5678”} 3.0783430989068856e-05 ……
#HELP pg_stat_statements_temp_blks_read Total number of temp blocks read by the statement #TYPE pg_stat_statements_temp_blks_read counter pg_stat_statements_temp_blks_read{datname=”unvdb”,queryid=”-1708726048587104477”,rolname=”monitor”,server=”192.168.2.81:5678”} 0 pg_stat_statements_temp_blks_read{datname=”unvdb”,queryid=”-1708726048587104477”,rolname=”unvdb”,server=”192.168.2.81:5678”} 0 ……
#HELP pg_stat_statements_temp_blks_written Total number of temp blocks written by the statement #TYPE pg_stat_statements_temp_blks_written counter pg_stat_statements_temp_blks_written{datname=”unvdb”,queryid=”-1708726048587104477”,rolname=”monitor”,server=”192.168.2.81:5678”} 0 pg_stat_statements_temp_blks_written{datname=”unvdb”,queryid=”-1708726048587104477”,rolname=”unvdb”,server=”192.168.2.81:5678”} 0 ……
#HELP pg_stat_statements_total_time_seconds Total time spent in the statement, in milliseconds #TYPE pg_stat_statements_total_time_seconds counter pg_stat_statements_total_time_seconds{datname=”unvdb”,queryid=”-1708726048587104477”,rolname=”monitor”,server=”192.168.2.81:5678”} 0.0013368759999999996 pg_stat_statements_total_time_seconds{datname=”unvdb”,queryid=”-1708726048587104477”,rolname=”unvdb”,server=”192.168.2.81:5678”} 0.001700654 ……
#HELP pg_stat_user_tables_analyze_count Number of times this table has been manually analyzed #TYPE pg_stat_user_tables_analyze_count counter pg_stat_user_tables_analyze_count{datname=”unvdb”,relname=”t_user”,schemaname=”public”,server=”192.168.2.81:5678”} 0
#HELP pg_stat_user_tables_autoanalyze_count Number of times this table has been analyzed by the autovacuum daemon
#TYPE pg_stat_user_tables_autoanalyze_count counter
#功能:autoanalyze 守护进程分析此表的次数
#sql示例:select autoanalyze_count from PG_STAT_USER_TABLES
pg_stat_user_tables_autoanalyze_count{datname=”test1”,relname=”t1”,schemaname=”public”,server=”192.168.2.81:5678”} 0
pg_stat_user_tables_autoanalyze_count{datname=”unvdb”,relname=”db”,schemaname=”public”,server=”192.168.2.81:5678”} 0
……
#HELP pg_stat_user_tables_autovacuum_count Number of times this table has been vacuumed by the autovacuum daemon
#TYPE pg_stat_user_tables_autovacuum_count counter
#功能:autovacuum 守护进程分析此表的次数
#sql示例:select autovacuum_count from PG_STAT_USER_TABLES
pg_stat_user_tables_autovacuum_count{datname=”test”,relname=”t1”,schemaname=”public”,server=”192.168.2.81:5678”} 0
pg_stat_user_tables_autovacuum_count{datname=”unvdb”,relname=”db”,schemaname=”public”,server=”192.168.2.81:5678”} 0
……
#HELP pg_stat_user_tables_idx_scan Number of index scans initiated on this table #TYPE pg_stat_user_tables_idx_scan counter #功能:对表启动的索引扫描数 #sql示例: 查看该指标:select idx_scan from PG_STAT_USER_TABLES 查看使用索引在所有查询中所占比例: select idx_scan::float/(idx_scan+seq_scan) from pg_stat_all_tables where relname=’score’; #异常:对于索引而言,我们希望尽量减少全表扫描的使用,而尽量多使用索引,所以如果使用索引在所有查询中的比例比较低(低于0.05),则证明索引数量太少或者是现存的索引很少被使用到,需要增加索引。 pg_stat_user_tables_idx_scan{datname=”test”,relname=”t1”,schemaname=”public”,server=”192.168.2.81:5678”} NaN pg_stat_user_tables_idx_scan{datname=”unvdb”,relname=”db”,schemaname=”public”,server=”192.168.2.81:5678”} NaN ……
#HELP pg_stat_user_tables_idx_tup_fetch Number of live rows fetched by index scans #TYPE pg_stat_user_tables_idx_tup_fetch counter #功能:通过使用索引的简单索引扫描抓取的活表行数 #sql示例: 查看该指标:select idx_tup_fetch from PG_STAT_USER_TABLES #异常处理: #更多解释信息:idx_tup_read和idx_tup_fetch计算不同甚至没有任何可使用的位图扫描。 因为idx_tup_read计算从索引检索的索引项而idx_tup_fetch 计算从表抓取的活的行。如果任何死的或尚未提交的行使用索引进行抓取, 或通过唯一索引扫描避免任何堆抓取,则后者较小。 pg_stat_user_tables_idx_tup_fetch{datname=”test”,relname=”t1”,schemaname=”test”,server=”192.168.2.81:5678”} 0 pg_stat_user_tables_idx_tup_fetch{datname=”unvdb”,relname=”t_user”,schemaname=”public”,server=”192.168.2.81:5678”} 0 ……
#HELP pg_stat_user_tables_last_analyze Last time at which this table was manually analyzed #TYPE pg_stat_user_tables_last_analyze gauge #功能:上次手动分析的时间 #sql示例: 查看该指标:select last_analyze from PG_STAT_USER_TABLES 使用analyze进行更新 analyze [table[columns]]如果没有参数,则对数据库中的所有表进行分析,然后将统计信息放入pg_statistic中,以方便选取最优执行计划。 #异常处理:如果上一次手动analyse的时间较老,则可能导致表的统计信息较老,导致选择错误的执行计划。此时需要及时使用analyze命令来对表进行更新。 #更多解释信息: pg_stat_user_tables_last_analyze{datname=”test”,relname=”t1”,schemaname=”test”,server=”192.168.2.81:5678”} 0 pg_stat_user_tables_last_analyze{datname=”test”,relname=”t1”,schemaname=”test”,server=”192.168.2.81:5678”} 0 ……
#HELP pg_stat_user_tables_last_autoanalyze Last time at which this table was manually analyzed
#TYPE pg_stat_user_tables_last_analyze gauge
#功能:上次自动分析的时间
#sql示例:
查看该指标:select last_autoanalyze from PG_STAT_USER_TABLES
查看autoanalyze设置:unvdb=# show autovacuum_analyze_scale_factor;-[ RECORD 1 ]-------------------+----autovacuum_analyze_scale_factor | 0.1Time: 0.348 msunvdb=# show autovacuum_analyze_threshold;-[ RECORD 1 ]----------------+---autovacuum_analyze_threshold | 50
何时发生auto analyze? 假设A为update的tuples计数值,B 为delete的tuples计数值 ,C为insert的tuples的计数值 .那么 (A+B+C)>(0.1*tuples+50)时,将会发生自动autoanalyze。可以修改这两个参数从而修改analyze频率 #异常处理:如果上一次手动analyse的时间较老,则可能导致表的统计信息较老,导致选择错误的执行计划。此时需要及时使用analyze命令来对表进行更新。 #更多解释信息: pg_stat_user_tables_last_autoanalyze{datname=”test”,relname=”csv”,schemaname=”public”,server=”192.168.2.81:5678”} 0 pg_stat_user_tables_last_autoanalyze{datname=”unvdb”,relname=”t_user”,schemaname=”public”,server=”192.168.2.81:5678”} 0 ……
#HELP pg_stat_user_tables_last_autovacuum Last time at which this table was vacuumed by the autovacuum daemon
#TYPE pg_stat_user_tables_last_autovacuum gauge
#功能:上次自动清理回收的时间
#sql示例:
查看该指标:select last_autovacuum from PG_STAT_USER_TABLES
查看autoanalyze设置:unvdb=# show autovacuum_analyze_scale_factor;-[ RECORD 1 ]-------------------+----autovacuum_analyze_scale_factor | 0.1Time: 0.348 msunvdb=# show autovacuum_analyze_threshold;-[ RECORD 1 ]----------------+---autovacuum_analyze_threshold | 50
何时发生autovacuum? 假设A为update的tuples计数值,B 为delete的tuples计数值 ,C为insert的tuples的计数值 .那么 (A+B+C)>(0.1*tuples+50)时,将会发生自动autovacuum。可以修改这两个参数从而修改vacuum频率 #异常处理:如果上一次手动vacuum的时间较老,则可能导致表的冗余信息较多,消耗更多的磁盘空间。此时需要及时使用vacuum命令来对表进行更新。 #更多解释信息 pg_stat_user_tables_last_autovacuum{datname=”test”,relname=”t1”,schemaname=”test”,server=”192.168.2.81:5678”} 0 pg_stat_user_tables_last_autovacuum{datname=”unvdb”,relname=”t_user”,schemaname=”public”,server=”192.168.2.81:5678”} 0 ……
#HELP pg_stat_user_tables_last_vacuum Last time at which this table was manually vacuumed (not counting VACUUM FULL) #TYPE pg_stat_user_tables_last_vacuum gauge #功能:上次手动回收的时间 #sql示例: 查看该指标:select last_vacuum from PG_STAT_USER_TABLES vacuum命令:vacuum table(column)没有接表名的话,默认对该数据库所有表进行清理 #异常处理:如果上一次手动vacuum的时间较老,则可能导致表的冗余信息较多,消耗更多的磁盘空间。此时需要及时使用vacuum命令来对表进行更新。 #更多解释信息 pg_stat_user_tables_last_vacuum{datname=”test”,relname=”csv”,schemaname=”public”,server=”192.168.2.81:5678”} 0 pg_stat_user_tables_last_vacuum{datname=”unvdb”,relname=”t_user”,schemaname=”public”,server=”192.168.2.81:5678”} 0
#HELP pg_stat_user_tables_n_dead_tup Estimated number of dead rows #TYPE pg_stat_user_tables_n_dead_tup gauge #功能:每个表中未回收的行 #sql示例: 查看该指标:select n_dead_tup,n_live_tup from PG_STAT_USER_TABLES; #异常管理:如果该指标数量过大,则要手动调用vacuum命令进行清理 #更多解释信息:在对表的更新操作中,会出现dead_tup,会导致udb运行的越来越慢,需要及时清理。 pg_stat_user_tables_n_dead_tup{datname=”test”,relname=”t1”,schemaname=”test”,server=”192.168.2.81:5678”} 0 pg_stat_user_tables_n_dead_tup{datname=”unvdb”,relname=”t_user”,schemaname=”public”,server=”192.168.2.81:5678”} 0 ……
#HELP pg_stat_user_tables_n_live_tup Estimated number of live rows #TYPE pg_stat_user_tables_n_live_tup gauge #功能:每个表中数据量占的行 #sql示例: 查看该指标:select n_dead_tup,n_live_tup from PG_STAT_USER_TABLES; #异常管理 #更多解释信息 pg_stat_user_tables_n_live_tup{datname=”unvdb”,relname=”t_user”,schemaname=”public”,server=”192.168.2.81:5678”} 0
#HELP pg_stat_user_tables_n_mod_since_analyze Estimated number of rows changed since last analyze #TYPE pg_stat_user_tables_n_mod_since_analyze gauge #功能:最后一次分析后被修改的行估计数量 #sql示例:查看该指标:select n_mod_since_analyze from PG_STAT_USER_TABLES; #异常管理:若该值占总行数比例过高,则统计信息估计过老,需手动调用analyze命令。 #更多解释信息
pg_stat_user_tables_n_mod_since_analyze{datname=”thinkcms”,relname=”qrtz_calendars”,schemaname=”public”,server=”192.168.2.81:5678”} 0 pg_stat_user_tables_n_mod_since_analyze{datname=”unvdb”,relname=”t_user”,schemaname=”public”,server=”192.168.2.81:5678”} 0 ……
#HELP pg_stat_user_tables_n_tup_del Number of rows deleted
#TYPE pg_stat_user_tables_n_tup_del counter
#功能:删除的数据行数
#sql示例:查看该指标:select n_tup_del from PG_STAT_USER_TABLES;
pg_stat_user_tables_n_tup_del{datname=”thinkcms”,relname=”tk_user_site_setting”,schemaname=”public”,server=”192.168.2.81:5678”} 0
pg_stat_user_tables_n_tup_del{datname=”unvdb”,relname=”t_user”,schemaname=”public”,server=”192.168.2.81:5678”} 0
……
#HELP pg_stat_user_tables_n_tup_hot_upd Number of rows HOT updated (i.e., with no separate index update required) #TYPE pg_stat_user_tables_n_tup_hot_upd counter #功能:hot update的行数 #sql示例:查看该指标:select n_tup_hot_upd from PG_STAT_USER_TABLES; #异常处理:hot update的数据行数,这个值与n_tup_upd接近说明更新性能较好,不需要更新索引。如果差异较大,则更新索引 pg_stat_user_tables_n_tup_hot_upd{datname=”thinkcms”,relname=”tk_template_type”,schemaname=”public”,server=”192.168.2.81:5678”} 0 pg_stat_user_tables_n_tup_hot_upd{datname=”thinkcms”,relname=”tk_user_site_setting”,schemaname=”public”,server=”192.168.2.81:5678”} 0 pg_stat_user_tables_n_tup_hot_upd{datname=”unvdb”,relname=”t_user”,schemaname=”public”,server=”192.168.2.81:5678”} 0 ……
#HELP pg_stat_user_tables_n_tup_ins Number of rows inserted
#TYPE pg_stat_user_tables_n_tup_ins counter
#功能:插入的数据行数的行数
#sql示例:查看该指标:select n_tup_ins from PG_STAT_USER_TABLES;
pg_stat_user_tables_n_tup_ins{datname=”thinkcms”,relname=”tk_user_site_setting”,schemaname=”public”,server=”192.168.2.81:5678”} 0
pg_stat_user_tables_n_tup_ins{datname=”unvdb”,relname=”t_user”,schemaname=”public”,server=”192.168.2.81:5678”} 0
……
#HELP pg_stat_user_tables_n_tup_upd Number of rows updated
#TYPE pg_stat_user_tables_n_tup_upd counter
#功能:数据更新的行数
#sql示例:查看该指标:select n_tup_upd from PG_STAT_USER_TABLES;
pg_stat_user_tables_n_tup_upd{datname=”thinkcms”,relname=”tk_user_site_setting”,schemaname=”public”,server=”192.168.2.81:5678”} 0
pg_stat_user_tables_n_tup_upd{datname=”unvdb”,relname=”t_user”,schemaname=”public”,server=”192.168.2.81:5678”} 0
……
#HELP pg_stat_user_tables_seq_scan Number of sequential scans initiated on this table #TYPE pg_stat_user_tables_seq_scan counter #功能:表进行全表扫描的次数 #sql示例:查看该指标:select seq_scan from PG_STAT_USER_TABLES; #异常处理:与idx_scan数量比较,若较小,则说明索引使用较少,需要添加索引 pg_stat_user_tables_seq_scan{datname=”thinkcms”,relname=”tk_user_site_setting”,schemaname=”public”,server=”192.168.2.81:5678”} 0 pg_stat_user_tables_seq_scan{datname=”unvdb”,relname=”t_user”,schemaname=”public”,server=”192.168.2.81:5678”} 0 ……
#HELP pg_stat_user_tables_seq_tup_read Number of live rows fetched by sequential scans #TYPE pg_stat_user_tables_seq_tup_read counter #功能:全表扫描的数据行数 #sql示例:查看该指标:select seq_tup_read from PG_STAT_USER_TABLES; #异常处理:全表扫描的数据行数,如果这个值很大说明操作这个表的SQL语句很可能是全表扫描,需要结合执行计划分析 pg_stat_user_tables_seq_tup_read{datname=”thinkcms”,relname=”tk_user_site_setting”,schemaname=”public”,server=”192.168.2.81:5678”} 0 pg_stat_user_tables_seq_tup_read{datname=”unvdb”,relname=”t_user”,schemaname=”public”,server=”192.168.2.81:5678”} 0 ……
#HELP pg_stat_user_tables_vacuum_count Number of times this table has been manually vacuumed (not counting VACUUM FULL) #TYPE pg_stat_user_tables_vacuum_count counter #功能:表进行vacuum的次数 #sql示例:查看该指标:select vacuum_count from PG_STAT_USER_TABLES; #更多解释信息:可以显示表插入更新的频率 pg_stat_user_tables_vacuum_count{datname=”thinkcms”,relname=”tk_user_site_setting”,schemaname=”public”,server=”192.168.2.81:5678”} 0 pg_stat_user_tables_vacuum_count{datname=”unvdb”,relname=”t_user”,schemaname=”public”,server=”192.168.2.81:5678”} 0 ……
#HELP pg_static Version string as reported by postgres #TYPE pg_static untyped #数据库版本信息 #更多解释信息:一般数据库的版本号为22或者22+ pg_static{server=”192.168.2.81:5678”,short_version=”22.4.0”,version=”UnvDB 22.4 on x86_64-pc-linux-gnu, compiled by gcc (GCC) 4.8.5 20150623 (Red Hat 4.8.5-44), 64-bit”} 1 ……
#HELP pg_statio_user_tables_heap_blks_hit Number of buffer hits in this table #TYPE pg_statio_user_tables_heap_blks_hit counter #功能:从shared buffer命中的块数 #sql示例:查看该指标:select heap_blks_hit from pg_statio_user_tables; #异常处理:该值过低,说明share buffer过小,需调大该值 pg_statio_user_tables_heap_blks_hit{datname=”thinkcms”,relname=”tk_user_site_setting”,schemaname=”public”,server=”192.168.2.81:5678”} 0 pg_statio_user_tables_heap_blks_hit{datname=”unvdb”,relname=”t_user”,schemaname=”public”,server=”192.168.2.81:5678”} 0 ……
#HELP pg_statio_user_tables_heap_blks_read Number of disk blocks read from this table #TYPE pg_statio_user_tables_heap_blks_read counter #功能:从page cache或磁盘读取表的块数 #sql示例:查看该指标:select heap_blks_read from pg_statio_user_tables; #异常处理:该值过高,说明share buffer过小,需要频繁从cache或磁盘读取,需调大该值。 pg_statio_user_tables_heap_blks_read{datname=”thinkcms”,relname=”tk_user_site_setting”,schemaname=”public”,server=”192.168.2.81:5678”} 0 pg_statio_user_tables_heap_blks_read{datname=”unvdb”,relname=”t_user”,schemaname=”public”,server=”192.168.2.81:5678”} 0 ……
#HELP pg_statio_user_tables_idx_blks_hit Number of buffer hits in all indexes on this table #TYPE pg_statio_user_tables_idx_blks_hit counter #功能:从shared buffer命中的索引块数 #sql示例:查看该指标:select idx_blks_hit from pg_statio_user_tables; #异常处理:该值过低,说明share buffer过小,需要频繁从cache或磁盘读取,需调大该值。 pg_statio_user_tables_idx_blks_hit{datname=”thinkcms”,relname=”tk_template_type”,schemaname=”public”,server=”192.168.2.81:5678”} 0 pg_statio_user_tables_idx_blks_hit{datname=”thinkcms”,relname=”tk_user_site_setting”,schemaname=”public”,server=”192.168.2.81:5678”} 0 pg_statio_user_tables_idx_blks_hit{datname=”unvdb”,relname=”t_user”,schemaname=”public”,server=”192.168.2.81:5678”} 0 ……
#HELP pg_statio_user_tables_idx_blks_read Number of disk blocks read from all indexes on this table #TYPE pg_statio_user_tables_idx_blks_read counter #功能:从page cache或磁盘读取索引的块数 #sql示例:查看该指标:select idx_blks_read from pg_statio_user_tables; #异常处理:该值过高,说明share buffer过小,需要频繁从cache或磁盘读取,需调大该值。 pg_statio_user_tables_idx_blks_read{datname=”thinkcms”,relname=”tk_user_site_setting”,schemaname=”public”,server=”192.168.2.81:5678”} 0 pg_statio_user_tables_idx_blks_read{datname=”unvdb”,relname=”t_user”,schemaname=”public”,server=”192.168.2.81:5678”} 0 ……
#HELP pg_statio_user_tables_tidx_blks_hit Number of buffer hits in this table’s TOAST table indexes (if any)
#TYPE pg_statio_user_tables_tidx_blks_hit counter
#功能:从page cache或者磁盘中读入的toast表索引的块数
#sql示例:查看该指标:select tidx_blks_hit from pg_statio_user_tables;
pg_statio_user_tables_tidx_blks_hit{datname=”thinkcms”,relname=”tk_user_site_setting”,schemaname=”public”,server=”192.168.2.81:5678”} NaN
pg_statio_user_tables_tidx_blks_hit{datname=”unvdb”,relname=”t_user”,schemaname=”public”,server=”192.168.2.81:5678”} 0
……
#HELP pg_statio_user_tables_tidx_blks_read Number of disk blocks read from this table’s TOAST table indexes (if any)
#TYPE pg_statio_user_tables_tidx_blks_read counter
#功能:在shared buffer中命中toast表索引的块数
#sql示例:查看该指标:select tidx_blks_hit from pg_statio_user_tables;
pg_statio_user_tables_tidx_blks_read{datname=”thinkcms”,relname=”tk_user_site_setting”,schemaname=”public”,server=”192.168.2.81:5678”} NaN
pg_statio_user_tables_tidx_blks_read{datname=”unvdb”,relname=”t_user”,schemaname=”public”,server=”192.168.2.81:5678”} 0
……
#HELP pg_statio_user_tables_toast_blks_hit Number of buffer hits in this table’s TOAST table (if any)
#TYPE pg_statio_user_tables_toast_blks_hit counter
#功能:在shared buffer中命中toast表的块数
#sql示例:查看该指标:select toast_blks_hit from pg_statio_user_tables;
pg_statio_user_tables_toast_blks_hit{datname=”thinkcms”,relname=”tk_user_site_setting”,schemaname=”public”,server=”192.168.2.81:5678”} NaN
pg_statio_user_tables_toast_blks_hit{datname=”unvdb”,relname=”t_user”,schemaname=”public”,server=”192.168.2.81:5678”} 0
……
#HELP pg_statio_user_tables_toast_blks_read Number of disk blocks read from this table’s TOAST table (if any)
#TYPE pg_statio_user_tables_toast_blks_read counter
#功能:从page cache或磁盘读取的toast表的块数
#sql示例:查看该指标:select toast_blks_read from pg_statio_user_tables;
pg_statio_user_tables_toast_blks_read{datname=”thinkcms”,relname=”tk_user_site_setting”,schemaname=”public”,server=”192.168.2.81:5678”} NaN
pg_statio_user_tables_toast_blks_read{datname=”unvdb”,relname=”t_user”,schemaname=”public”,server=”192.168.2.81:5678”} 0
……
#HELP pg_up Whether the last scrape of metrics from UDB was able to connect to the server (1 for yes, 0 for no). #TYPE pg_up gauge pg_up 1 #功能:描述udb是否连接上了exporter服务器
#HELP postgres_exporter_build_info A metric with a constant ‘1’ value labeled by version, revision, branch, and goversion from which postgres_exporter was built. #TYPE postgres_exporter_build_info gauge postgres_exporter_build_info{branch=”HEAD”,goversion=”go1.18.5”,revision=”b5fd2465646a09bb1c8dbd5c9c00b852da93927a”,version=”0.11.1”} 1
#HELP process_cpu_seconds_total Total user and system CPU time spent in seconds. #TYPE process_cpu_seconds_total counter process_cpu_seconds_total 1.86
#HELP process_max_fds Maximum number of open file descriptors. #TYPE process_max_fds gauge process_max_fds 1.048576e+06
#HELP process_open_fds Number of open file descriptors. #TYPE process_open_fds gauge process_open_fds 17
#HELP process_resident_memory_bytes Resident memory size in bytes. #TYPE process_resident_memory_bytes gauge process_resident_memory_bytes 1.4262272e+07
#HELP process_start_time_seconds Start time of the process since unix epoch in seconds. #TYPE process_start_time_seconds gauge process_start_time_seconds 1.66694181121e+09
#HELP process_virtual_memory_bytes Virtual memory size in bytes. #TYPE process_virtual_memory_bytes gauge process_virtual_memory_bytes 7.31275264e+08
#HELP process_virtual_memory_max_bytes Maximum amount of virtual memory available in bytes. #TYPE process_virtual_memory_max_bytes gauge process_virtual_memory_max_bytes 1.8446744073709552e+19
#HELP promhttp_metric_handler_requests_in_flight Current number of scrapes being served. #TYPE promhttp_metric_handler_requests_in_flight gauge promhttp_metric_handler_requests_in_flight 1
#HELP promhttp_metric_handler_requests_total Total number of scrapes by HTTP status code. #TYPE promhttp_metric_handler_requests_total counter promhttp_metric_handler_requests_total{code=”200”} 55 promhttp_metric_handler_requests_total{code=”500”} 0 promhttp_metric_handler_requests_total{code=”503”} 0